Characterizing cognitive brain networks using group-level statistical inferences of information-based measures
School Lyon - 22/10/2021
Etienne Combrisson - Postdoc BraiNets' team INT Marseille
# Program of the day
- Overview of the Frites software : what it is for, what can you do with it etc.
- Presentation of the sEEG data
- Data management : data formatting, data selection, input / output types etc.
- Measuring information : linking brain data to an external variable (stimulus types, behavior etc.)
- Statistics : group-level statistics, fixed- and random-effect models, non-parametric statistics, correction for multiple comparisons etc.
- Functional connectivity : directed and undirected functional connectivity, task-related functional connectivity etc.
- Application to your data
30min
1h30min
1h
1h
30min
My very optimistic program !
Frites
# Open-source Python software
- Pure Python software started in 2019
- Hosted on Github : https://github.com/brainets/frites
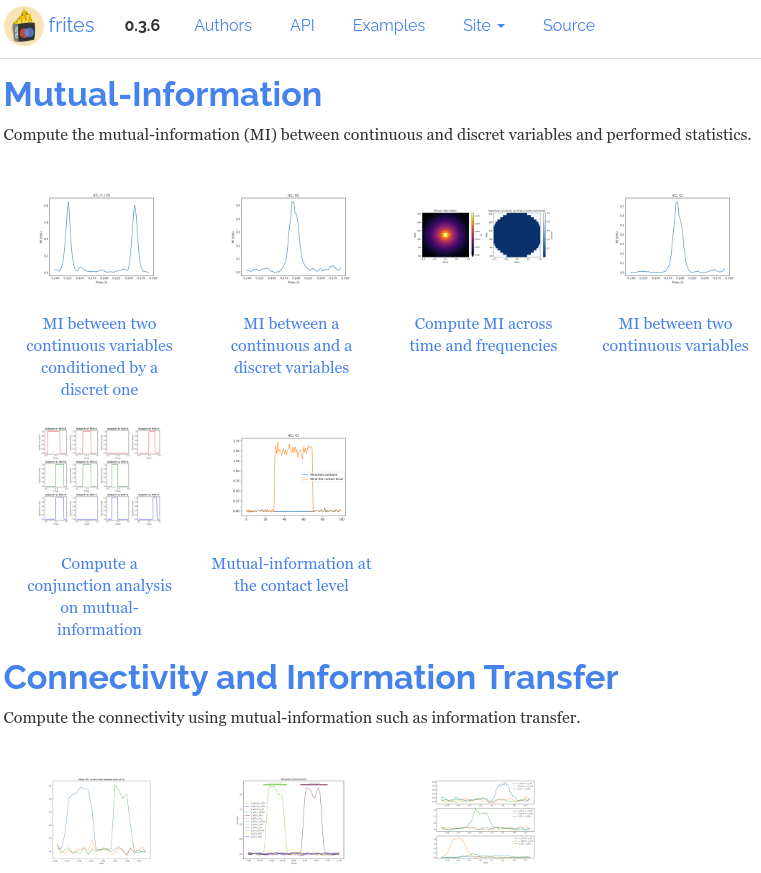
- Online documentation + Examples : https://brainets.github.io/frites
[FRITES] Framework for Information Theoretical analysis of Electrophysiological data and Statistics


Vinicius Lima Cordeiro
INT/INS, Marseille
# Shout out to main Frites' contributors
# Aim of the software : big picture
Brain data
Information Framework
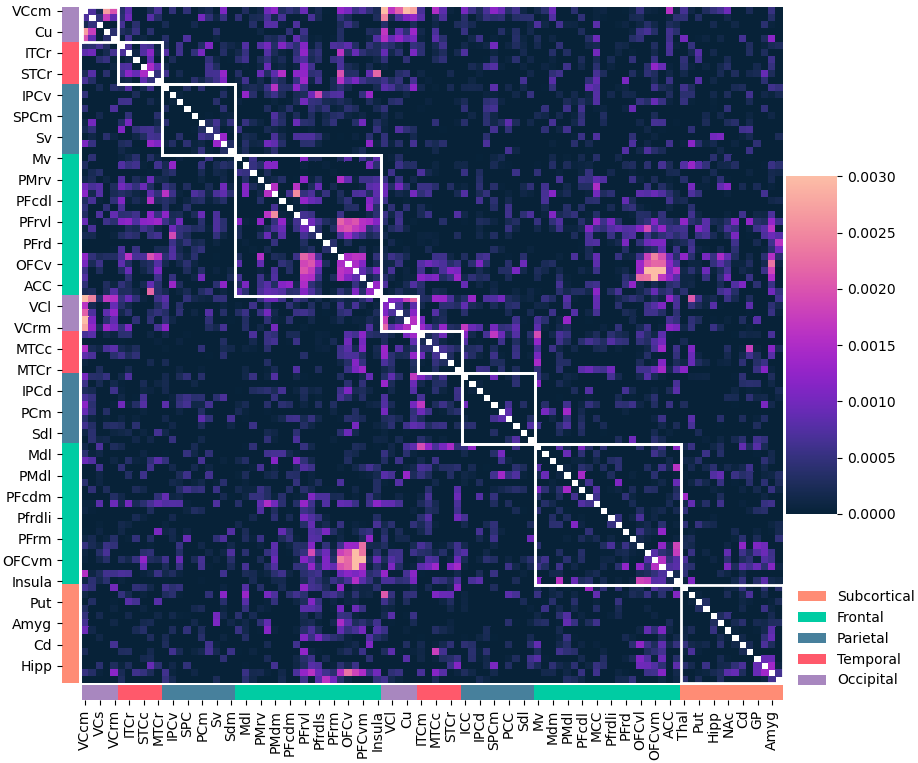
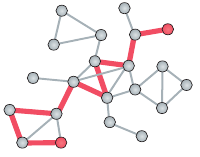
Task-related functional (un)directed connectivity
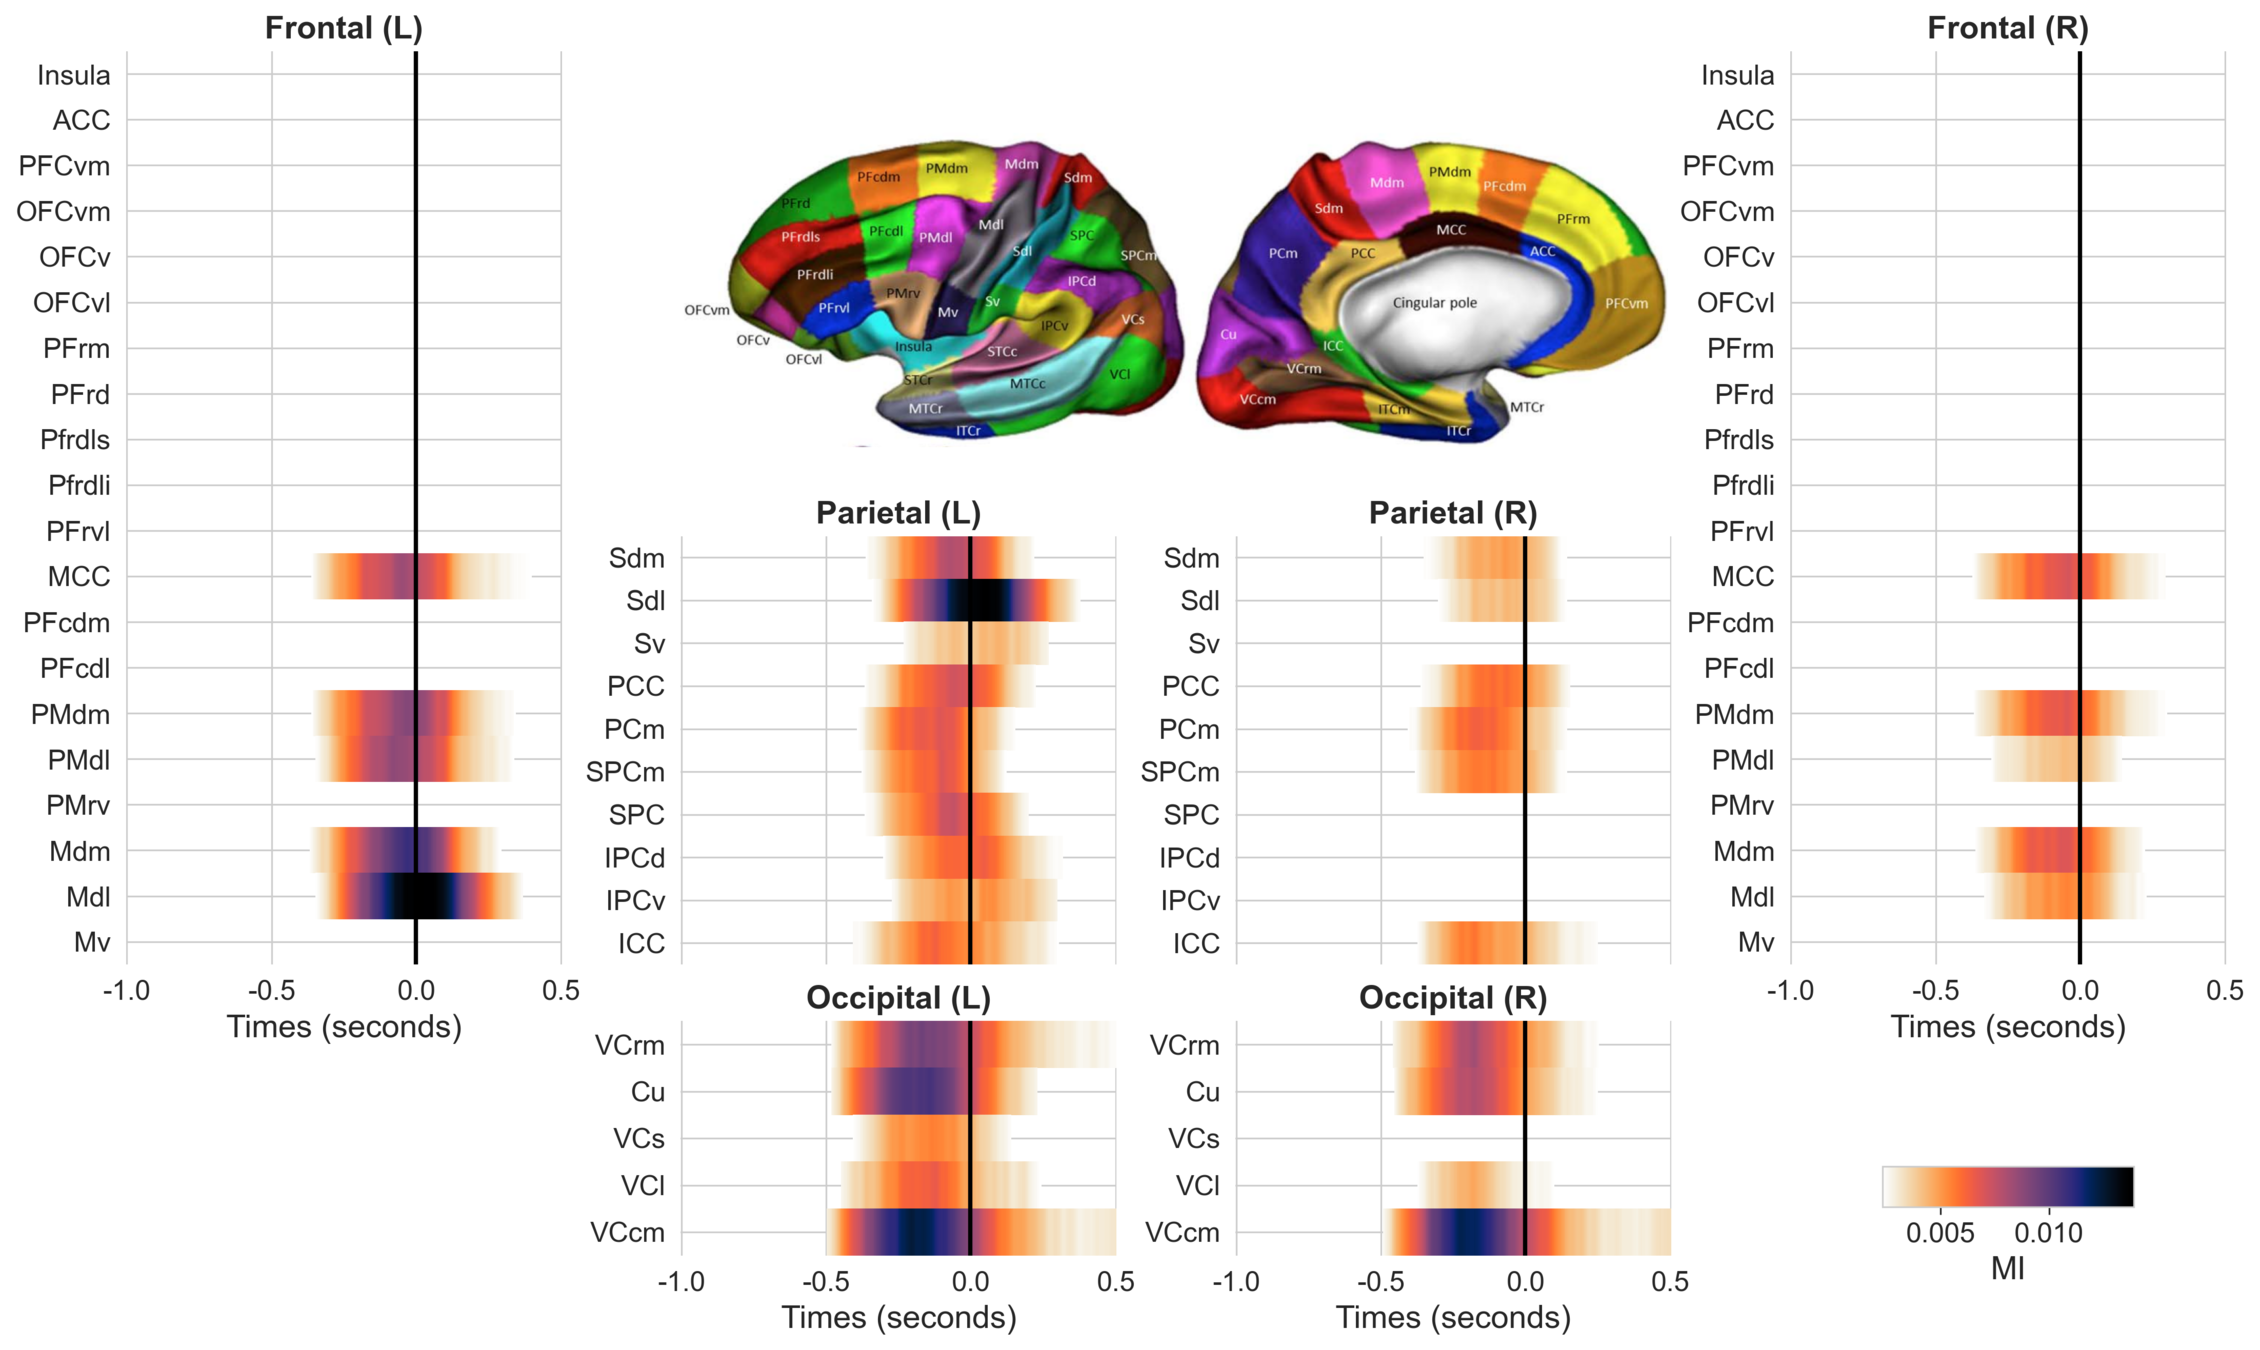
Local task-related
brain activity
Group-level statistical inferences
Extract dynamic spatiotemporal cognitive brain networks in relation to cognitive processes
# Aim of the software : in depth
Inputs
Local measures
power, phase, PAC etc.
Connectivity estimations
(d)FC, (un)directed
Graph-measures
degree, modularity, associativity etc.
Link with external variable
(IT)
Contrasting conditions
"classification" like
-
baseline vs. task
-
stimulus A vs. B
-
Reaction time (RT)
-
Learning model
-
Prediction error
Regression
"correlation" like
Removing influence
"partial-correlation" like
-
RT | {easy, hard}
Group-level statistics
Measure of information
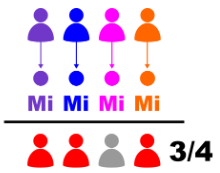
"Conjunction"
#subjects significant
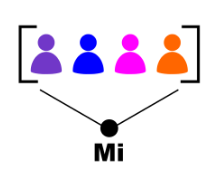
Fixed-effect
case studies
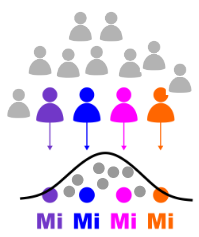
Random-effect
generalization
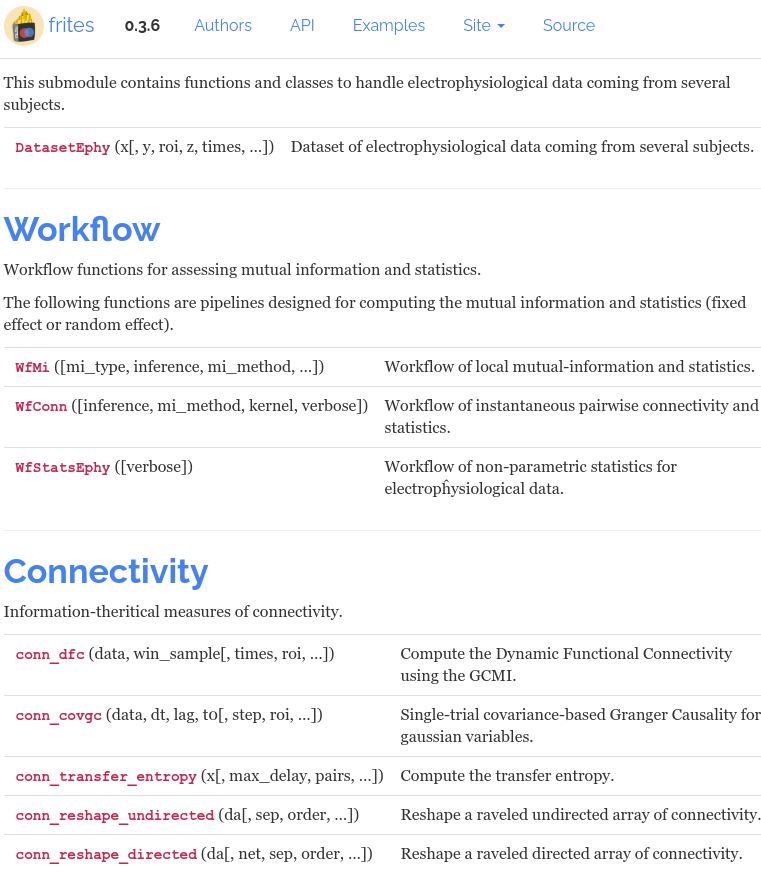
# Structure of the software
-
frites.dataset = data containers
- LFP / connectivity / PSD / TF maps etc.
- Single / Multi subjects & Single / Multi sessions
-
frites.workflows = computations performed on datasets
- Workflow of information (frites.workflows.WfMi)
- Workflow of statistics (frites.workflows.WfStats)
-
frites.conn = metrics of dynamic functional connectivity
- Undirected connectivity (frites.conn.conn_dfc)
- Directed connectivity (frites.conn.conn_covgc)
- Others
- frites.estimator = home-made and custom information-based estimators (information-theory, machine-learning etc.)
- frites.simulations = create artificial simulated data
- frites.utils = utility functions (e.g. data smoothing)
# Typical framework
Data
Results
Task variable
-
Categorical variable
- Stimulus type
- Experimental condition
-
Continuous variable
- Behavioral model (PE, surprise)
- Reaction time
Brain data
- LFP, connectivity, spikes, power, TF maps etc.
- Single / Multi subjects
- Single / Multi sessions
- Single / Multi brain regions
Effect size
- Per brain region / electrode
- Dynamic (per time point if there's a time axis)
- Per or across a population (i.e. across subjects or sessions)
P-value
- Same dimension as the effect size
- Corrected for multiple-comparisons
Statistics
frites.workflows
WfStats
Corrected p-value
- Effect significantly differ from chance?
- Correct for multiple comparisons (time, space etc. e.g. using cluster-based)
- P-value inference
Information
frites.workflows
WfMi
Measure of effect size
- Linking the brain data to the task variable (I(x; y))
-
Provide a measure of effect size
- Per / across subjects
- Per / across sessions
Dataset
frites.dataset
DatasetEphy
Merge group data
- x = brain data
- y = task variable
- Checking data properly formatted
- Data conversion
Data presentation
# sEEG data and Probabilistic Learning Task
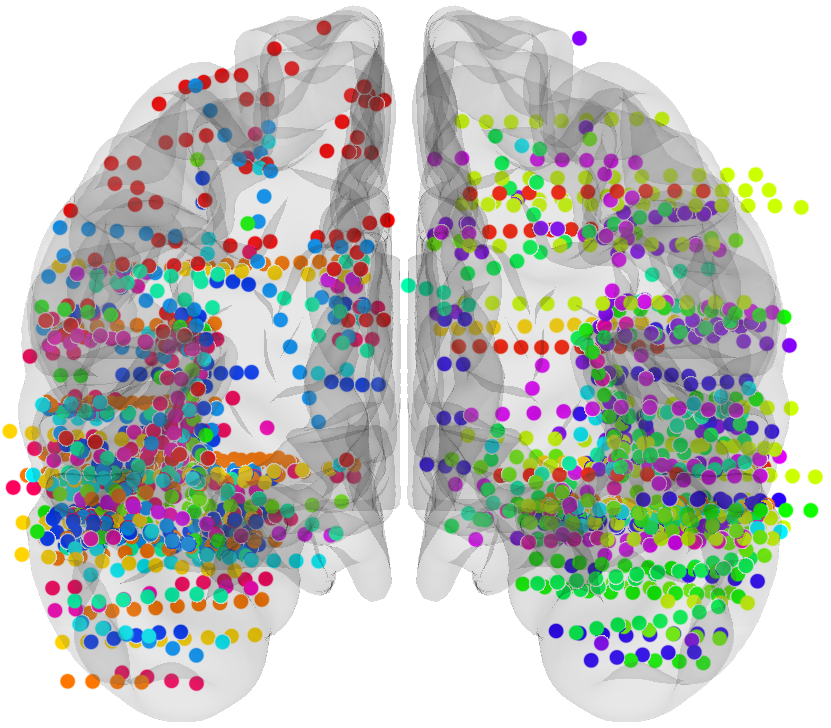
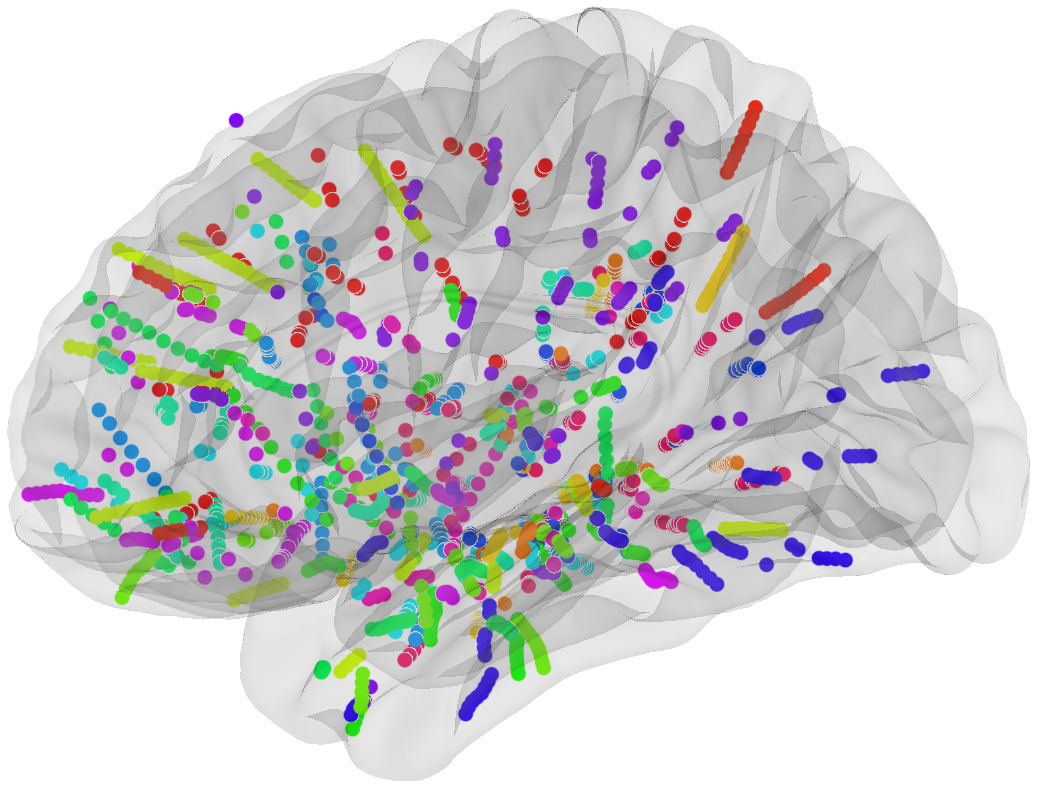
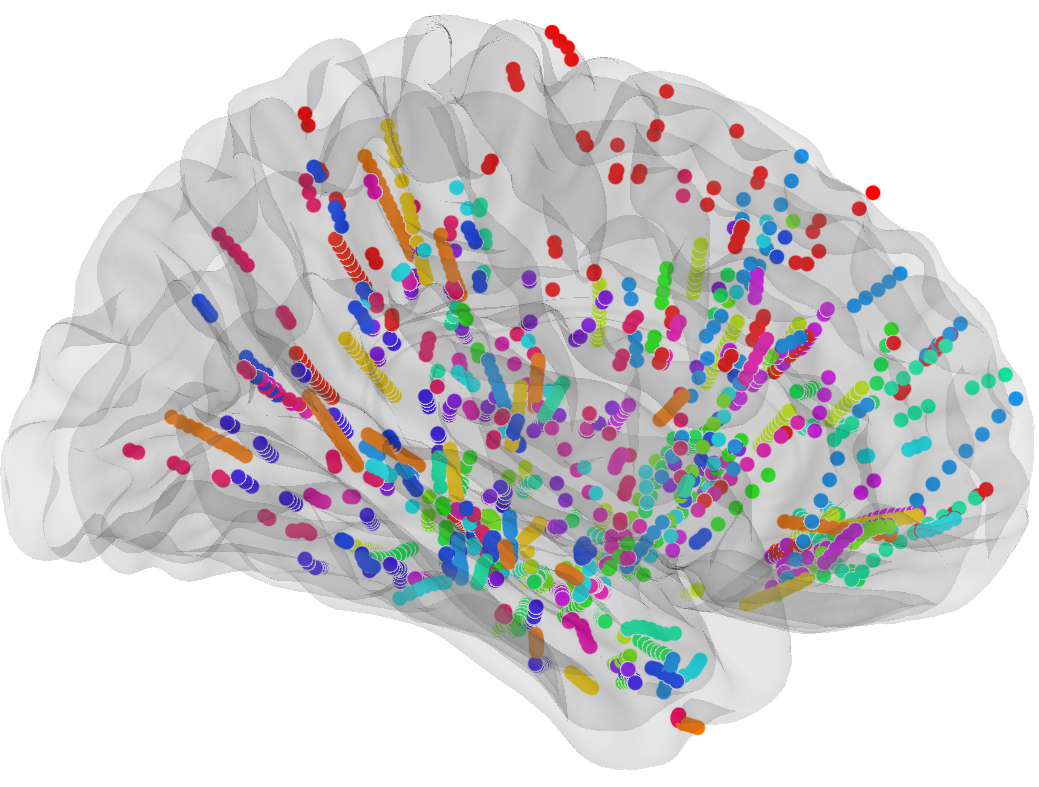
17 subjects with a pharmaco resistant epilepsy implanted with intracranial electrodes
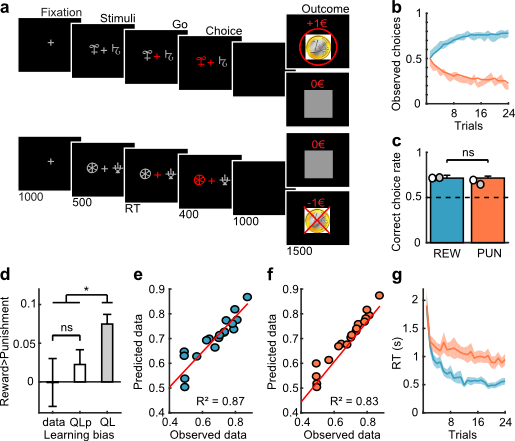
[REW] Reward condition
[PUN] Punishment condition
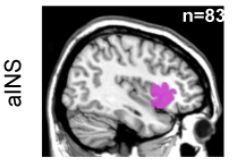
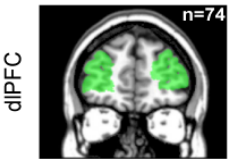
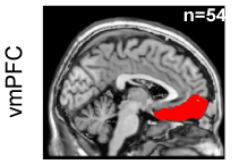
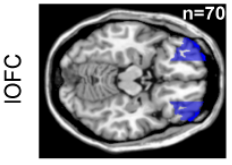
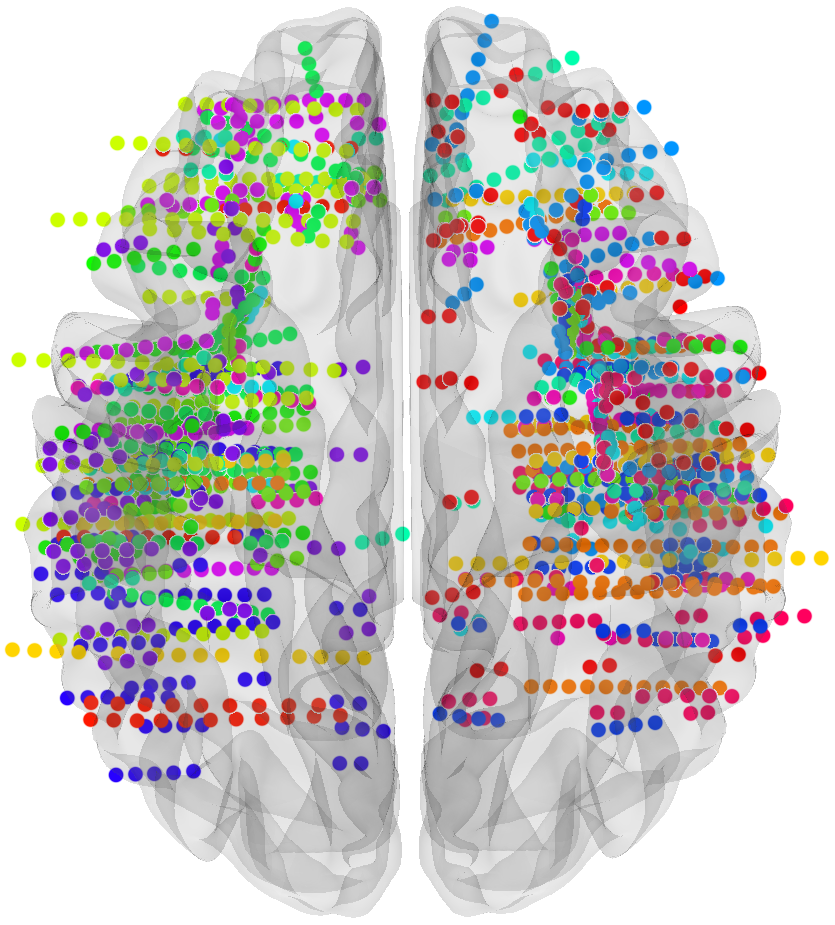
# Four cortical regions involved during learning
Inside each brain region, there is multiple recording sites (i.e. channels / contacts) coming from multiple subjects (potentially different)
# Data organisation
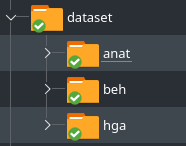
[anat] Single subject excel files containing anatomical informations. Two columns :
- contact : name of the recording contact
- roi : (region of interest) name of the brain region
[beh] Single subject excel files containing behavioral informations. Five columns :
- valence : outcome valence (+1€, +0€, -0€, -1€)
- code : conventional integer (2, 1, -1, -2)
- block : block design (series of stimuli)
- RT : reaction time
- PE : Prediction Error (learning model)
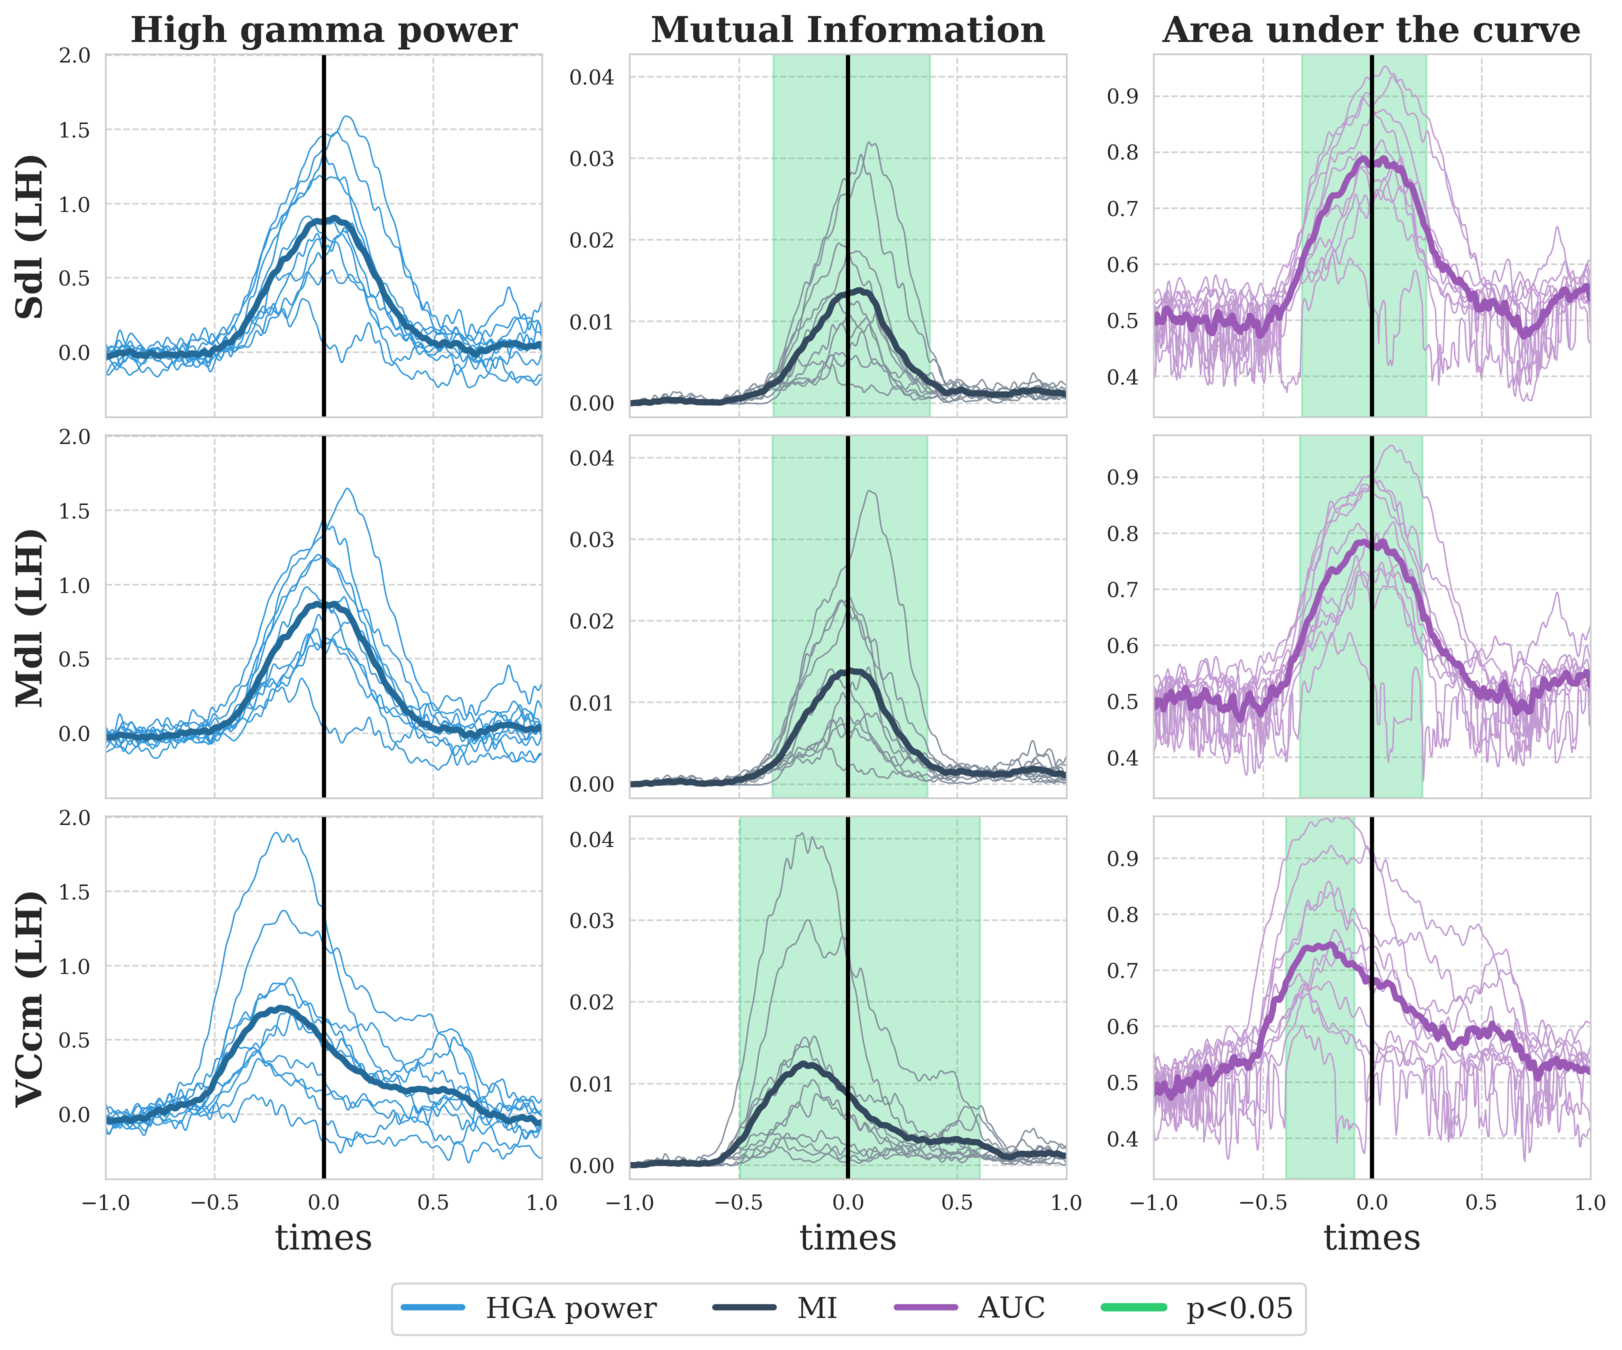
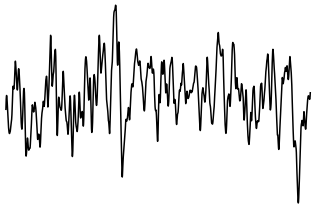
[hga] Single subject high-gamma activity (HGA). The data are saved as 3D arrays (n_epochs, n_channels, n_times)
# Open questions
- Can we find differences of high-gamma activity (HGA) during the reward condition (i.e contrasting +1€ vs. +0€)?
- Can we find differences of HGA during the punishment condition (i.e contrasting -1€ vs. -0€)?
- Can we find brain regions for which the HGA is correlated with the reaction time (RT)?
- Can we find brain regions for which the HGA is correlated with the prediction error (PE) during the reward or punishment condition?
I/O
# Data preparation
- "What are the input types supported by Frites?"
- "What is the output type of Frites' functions?"

Let's talk about how your data should be formatted to start using Frites
# Frites' inputs / outputs


INPUTS
OUTPUTS
# Why using xarray?
-1
-0.75
-0.5
-.025
0.
0.25
0.5
0.75
1.
1.25
3.
3.25
3.5
3.75
4.
4.25
4.5
4.75
5.
5.25
Times (seconds)
e1
e2
e3
e4
e5
e26
e27
e28
e29
e30
Electrodes
s1
s1
s1
s2
s2
s10
s10
s11
s11
s11
Subjects
Baseline
Period of interest
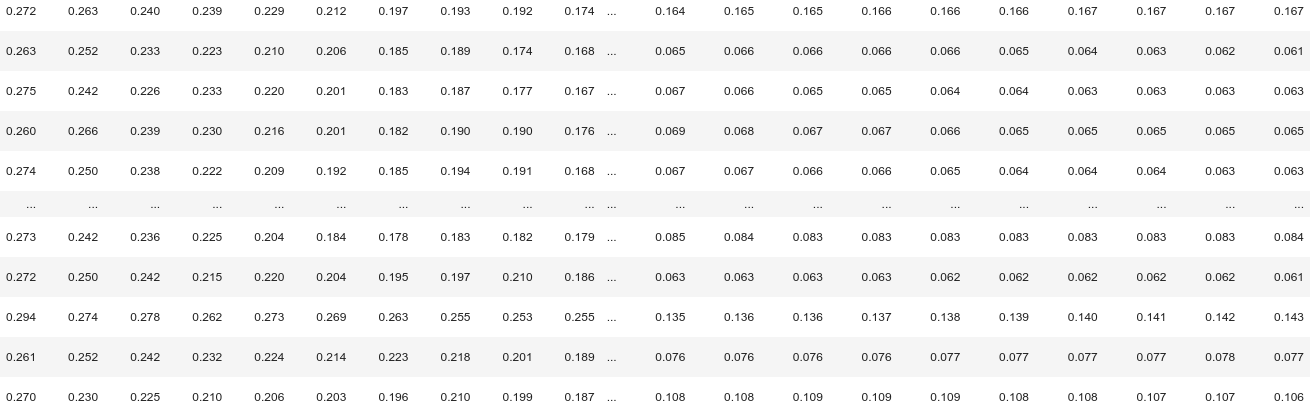
# Xarray = labelled NumPy array
Your data
Labelling
Labelling layer on top of your data to facilitate data selection and overall manipulations
# Data selection : NumPy vs. Xarray
"Select the neural activity during the baseline of subject 10, electrode 26"
# data.shape = (n_electrodes, n_times)

# select the electrode of the subject
is_subject = subject_names == 's10'
is_elec = elec_names == 'e26'
is_both = np.logical_and(is_subject, is_elec)

# select baseline activity
is_baseline = times < 0.

# apply selection to the data
data_n = data[is_both, is_baseline]
# data.shape = (n_electrodes, n_times)
# assuming that data is already an DataArray
data_n = data.sel(
subject='s10',
elec='e26',
times='baseline'
)# NumPy ↔ Xarray
NumPy → Xarray
Array labelling
import numpy as np
import xarray as xr

"""
raw.shape = NumPy array (n_electrodes, n_times)
elec_names = vector of electrode names (n_electodes,)
time_vec   = time vector (n_times,)
"""

raw_xr = xr.DataArray(
  raw,                           # NumPy array of data
  dims=('electrodes', 'times'),  # dimension names
  coords=(elec_names, time_vec)  # coordinates values
)
Xarray → NumPy
Drop labelling
import numpy as np
import xarray as xr

"""
raw_xr.shape = Xarray DataArray (n_electrodes, n_times)
elec_names = vector of electrode names (n_electodes,)
time_vec   = time vector (n_times,)
"""

# retrieve coordinates
elec_names = raw_xr['electrodes'].data
time_vec = raw_xr['times'].data

# get the raw data as a NumPy array
raw = raw_xr.data
# Scratching the surface of Xarray
Advantages of using Xarray
- Very clean and readable way to select to brain data !
- Save / load your data with the labels !
- Add attributes to your data (sampling frequency, experimental details etc.). Nice for sharing self contained files !
- many, Many, MaNy, MANY operations supported !
# maximum / minimum and mean across time points
data.max('times')
data.min('times')
data.mean('times')

# operations on groups
data.groupby('brain_regions').mean('brain_regions')
data.groupby('time_period').mean('time_period')

# add attributes
data.attrs['sampling_frequency'] = 1024.
data.attrs['session'] = 1
data.attrs['animal'] = 'rat_1'

# save and reload your data
data.to_netcdf('my_data.nc')
data = xr.open_dataarray('my_data.nc')
Limitations of Xarray
- There's a learning curve (definitly)
- Black box operations
- Documentation is not "neuro" oriented
# Coding : time to play with Xarray

Datasets
# Definition
frites.dataset.DatasetEphy
Container of brain data for then performing computations either on a single subject or on a population (i.e. to find reproducible effects across participants or sessions)
# Definition of a DatasetEphy
## Merging multiple participants
from frites.dataset import DatasetEphy

dt = DatasetEphy([raw_s1, raw_s2, raw_s2, raw_s3, raw_s4])
DatasetEphy([ ])
## Input type for each participant
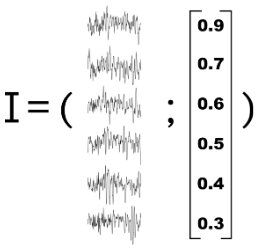
= | |
## Input shape for each participant
3D epochs data
- Raw = (n_epochs, n_electrodes, n_times)
- Power = (n_epochs, n_roi, n_times)
- PSD = (n_epochs, n_electrodes, n_frequencies)
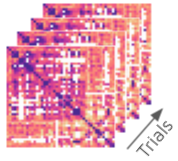
- Conn = (n_epochs, n_connections, 1)
4D epochs data
- TF = (n_epochs, n_electrodes, n_frequencies, n_times)
- CFC = (n_epochs, n_roi, n_phases, n_amplitudes)
- Coh = (n_epochs, n_connections, n_frequencies, n_times)
# Coding : time to play with Xarray
Measuring
information
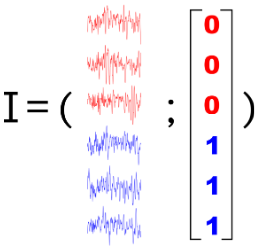
# Measures of information
Brain data
Power, spiking rate, functional connectivity etc.
Brain data
Measure of information
Reflects how much brain data carry information about the task (Kriegeskorte et al. 2006)
Task-variables and behavior
Discret stimulus, outcomes
Continuous psychometrics
Reaction times
Continuous behavioral models
Prediction error, Surprise
# Popular providers of measures of information
Information-based measures : how much a neural signal or a link between brain regions carry information about the task (Kriegeskorte et al., 2006)
-
Gaussian-Copula Mutual Information (GCMI, Ince et al. 2017)
- Great sensibility, noise resistance
- Bias-corrected (#number of trials per conditions)
- Computationally inexpenssive (i.e fast !)
- Monotonicity assumptions
-
Possibility to extend to other measures of information
- ML metrics
- Correlations (Pearson, Wilcoxon etc.)
- Measure of distance (e.g distance correlation)
Information-theory (IT)
Mutual-information, entropy
Model-free
Machine-learning (ML)
Classifiers, regressions
Model-based
# Default metric used in Frites and conventions
-
Gaussian-Copula Mutual Information (GCMI, Ince et al. 2017)
- Great sensibility, noise resistance
- Bias-corrected (#number of trials per conditions)
- Computationally inexpenssive (i.e fast !)
- Monotonicity assumptions
mi_type='cd'
-
brain data = continuous
-
variable = discrete
mi_type='cc'
-
brain data = continuous
-
variable = continuous
Contrasting conditions
Quantifying how much the brain activity differs between 2 (or more) conditions
Stimulus A vs. Stimulus B; Baseline vs. Outcome etc.
Correlation-like
"Correlate" brain activity with a continuous variable
Learning curve, contingency, surprise, prediction error etc.
# Coding : let's measure information
Statistics
# Overview of the statistics used in Frites
Three important points
- The goal of Frites is to being able to draw statistical inferences either at the single-subject level or at the population-level
- We are combining measures of information and non-parametric statistics
- The p-values can be corrected at several levels (test-wise or cluster-wise)
Combrisson, E., Allegra, M., Basanisi, R., Ince, R. A., Giordano, B., Bastin, J., & Brovelli, A. (2021). Group-level inference of information-based measures for the analyses of cognitive brain networks from neurophysiological data. under review + biorxiv
# Statistical inferences on a population
What does population mean?
- Goal : find effects that are present at the population level
- Problem : how to take into account the inter-subjects / sessions / contacts variability?
Several subjects
Several sessions from a single subject
Several recording sites in a single brain region
# Group-level statistics on information-based measures
Single-participant
Fixed-Effect
Random-Effect
Quantitative statistics
How many participant / contacts / sessions have the effect?
Typical characteristics of the population of participants
- Requires lower #participants
- Great power
- Reproducible effect
- Can't generalize
Average characteristics of the population of participants
- Can generalize
- Adapt to inter-subject variability
- Requires higher #participants
- P-values : inferred using permutation-based non-parameteric statistics + cluster-based correction for multiple-comparisons
- RFX : model of the population is flexible (participants / sessions / contacts)
Friston et al., NeuroImage (1999); Maris and Oostenveld, 2000; Giordano et al., 2017; Combrisson et al. in prep
# Coding : let's play with statistics
Functional
connectivity
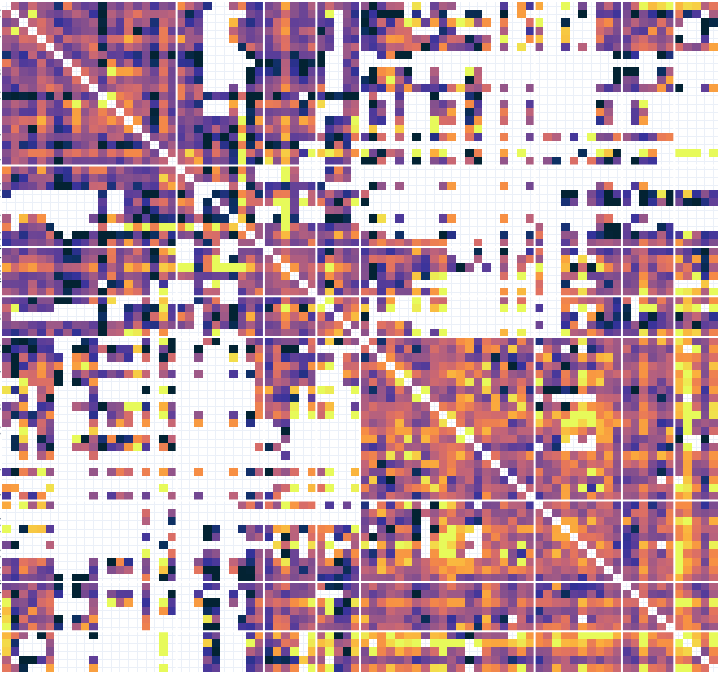
# Connectivity metrics : undirected amplitude correlation
Static functional connectivity
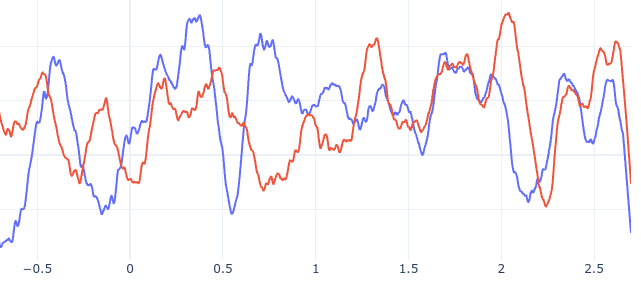
Contact 1
Contact 2

Times
Dynamic functional connectivity
Contact 1
Contact 2
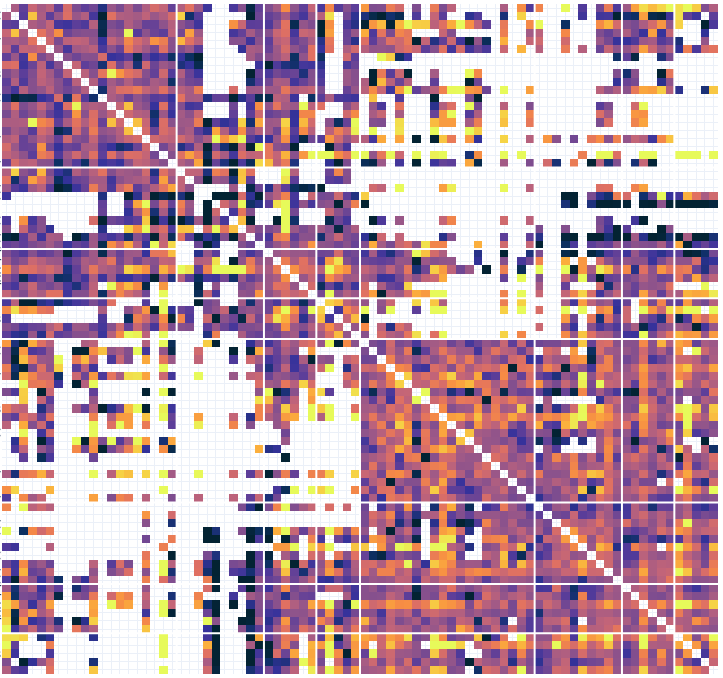
# Connectivity metrics : covariance-based Granger causality
I(roi_1past; roi_2present | roi_2past)
ROI 1
ROI 2
Static covGC
times
Dynamic covGC
# Coding : let's measure connectivity