hoi.plot.plot_landscape#
- hoi.plot.plot_landscape(hoi, model=None, orders=None, minsize=None, maxsize=None, kind='hist', undersampling=True, cbar=True, hist_kwargs={}, plt_kwargs={})[source]#
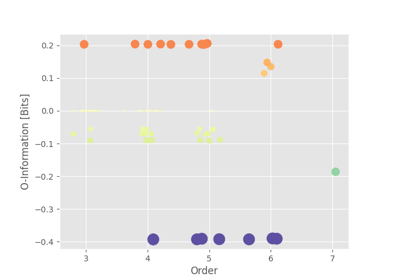
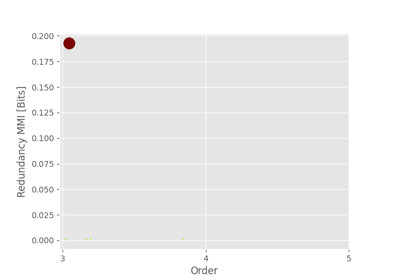
Landscape representation of higher order interactions.
- Parameters:
- hoiarray_like
Higher order interactions.
- modelhoi.metrics
Higher order interaction model.
- orders: array_like, optional
Order associated to each multiplet. The default is None.
- minsize, maxsizeint | 2, None
Minimum and maximum size of the multiplets
- kind{‘hist’, ‘scatter’}
Kind of plot. Use either:
‘hist’ : 2D histogram of the higher order interactions
‘scatter’ : scatter plot of the higher order interactions
- undersamplingbool | True
If True, plot the undersampling threshold.
- cbarbool | True
Add colorbar.
- hist_kwargsdict | {}
Optional arguments for the histogram.
- plt_kwargsdict | {}
Optional arguments for the plot. If kind is ‘hist’, the arguments are passed to plt.pcolormesh. If kind is ‘scatter’, the arguments are passed to plt.scatter.
- Returns:
- axaxis
Current axis.


