frites.conn.plot_windows#
- frites.conn.plot_windows(times, win_sample, x=None, title='', r_min=-0.75, r_max=0.75)[source]#
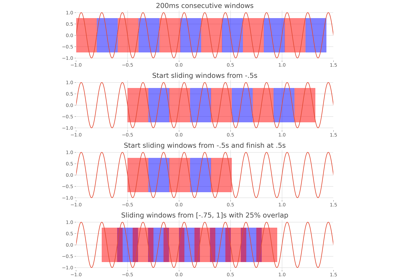
Simple plotting function for representing windows.
- Parameters:
- timesnumpy:array_like
Times vector of shape (n_times,)
- win_samplenumpy:array_like
Windows in samples.
- xnumpy:array_like |
python:None A signal to use as a background. If None, a pure sine is generated with 100ms period is generated
- title
python:str| ‘’ String title to attach to the figure
- r_min, r_max
python:float| -.75, .75 Window are represented by squares. Those two parameters can be used to control where box start and finish along the y-axis.
- Returns:
- ax
gca The matplotlib current axes
- ax
See also