Note
Go to the end to download the full example code.
Generate random electrophysiological data#
This example illustrates how to generate some random electrophysiological data, either for a single subject or multiple subjects.
import numpy as np

from frites.simulations import sim_single_suj_ephy, sim_multi_suj_ephy
from frites import set_mpl_style

import matplotlib.pyplot as plt
set_mpl_style()
Generate electrophysiological for a single subject#
Here we use the function frites.simulations.sim_single_suj_ephy() to
simulate data coming from a single subject. This function allows to define
array with the following shape (n_epochs, n_sites, n_times) where n_epochs
refer to the number of trials, n_sites the number of channels / recording
sites / sensors and n_times the number of time points.
The number of sites (n_sites) is defined using n_roi (number of region of interest) and n_sites_per_roi. Then n_sites = n_roi x n_sites_per_roi
This function also allow to simulate MEG / EEG data (modality=”meeg”) or intracranial data (modality=”intra”). The difference is that for intracranial data, the number of sites per region of interest (ROI) is also randomized
modality = 'meeg'
n_epochs = 10
n_roi = 2
n_sites_per_roi = 1
n_times = 100
data, roi, time = sim_single_suj_ephy(modality=modality, n_epochs=n_epochs,
                                      n_roi=n_roi, n_times=n_times,
                                      n_sites_per_roi=n_sites_per_roi)
print(f"List of defined region of interest : {roi}")


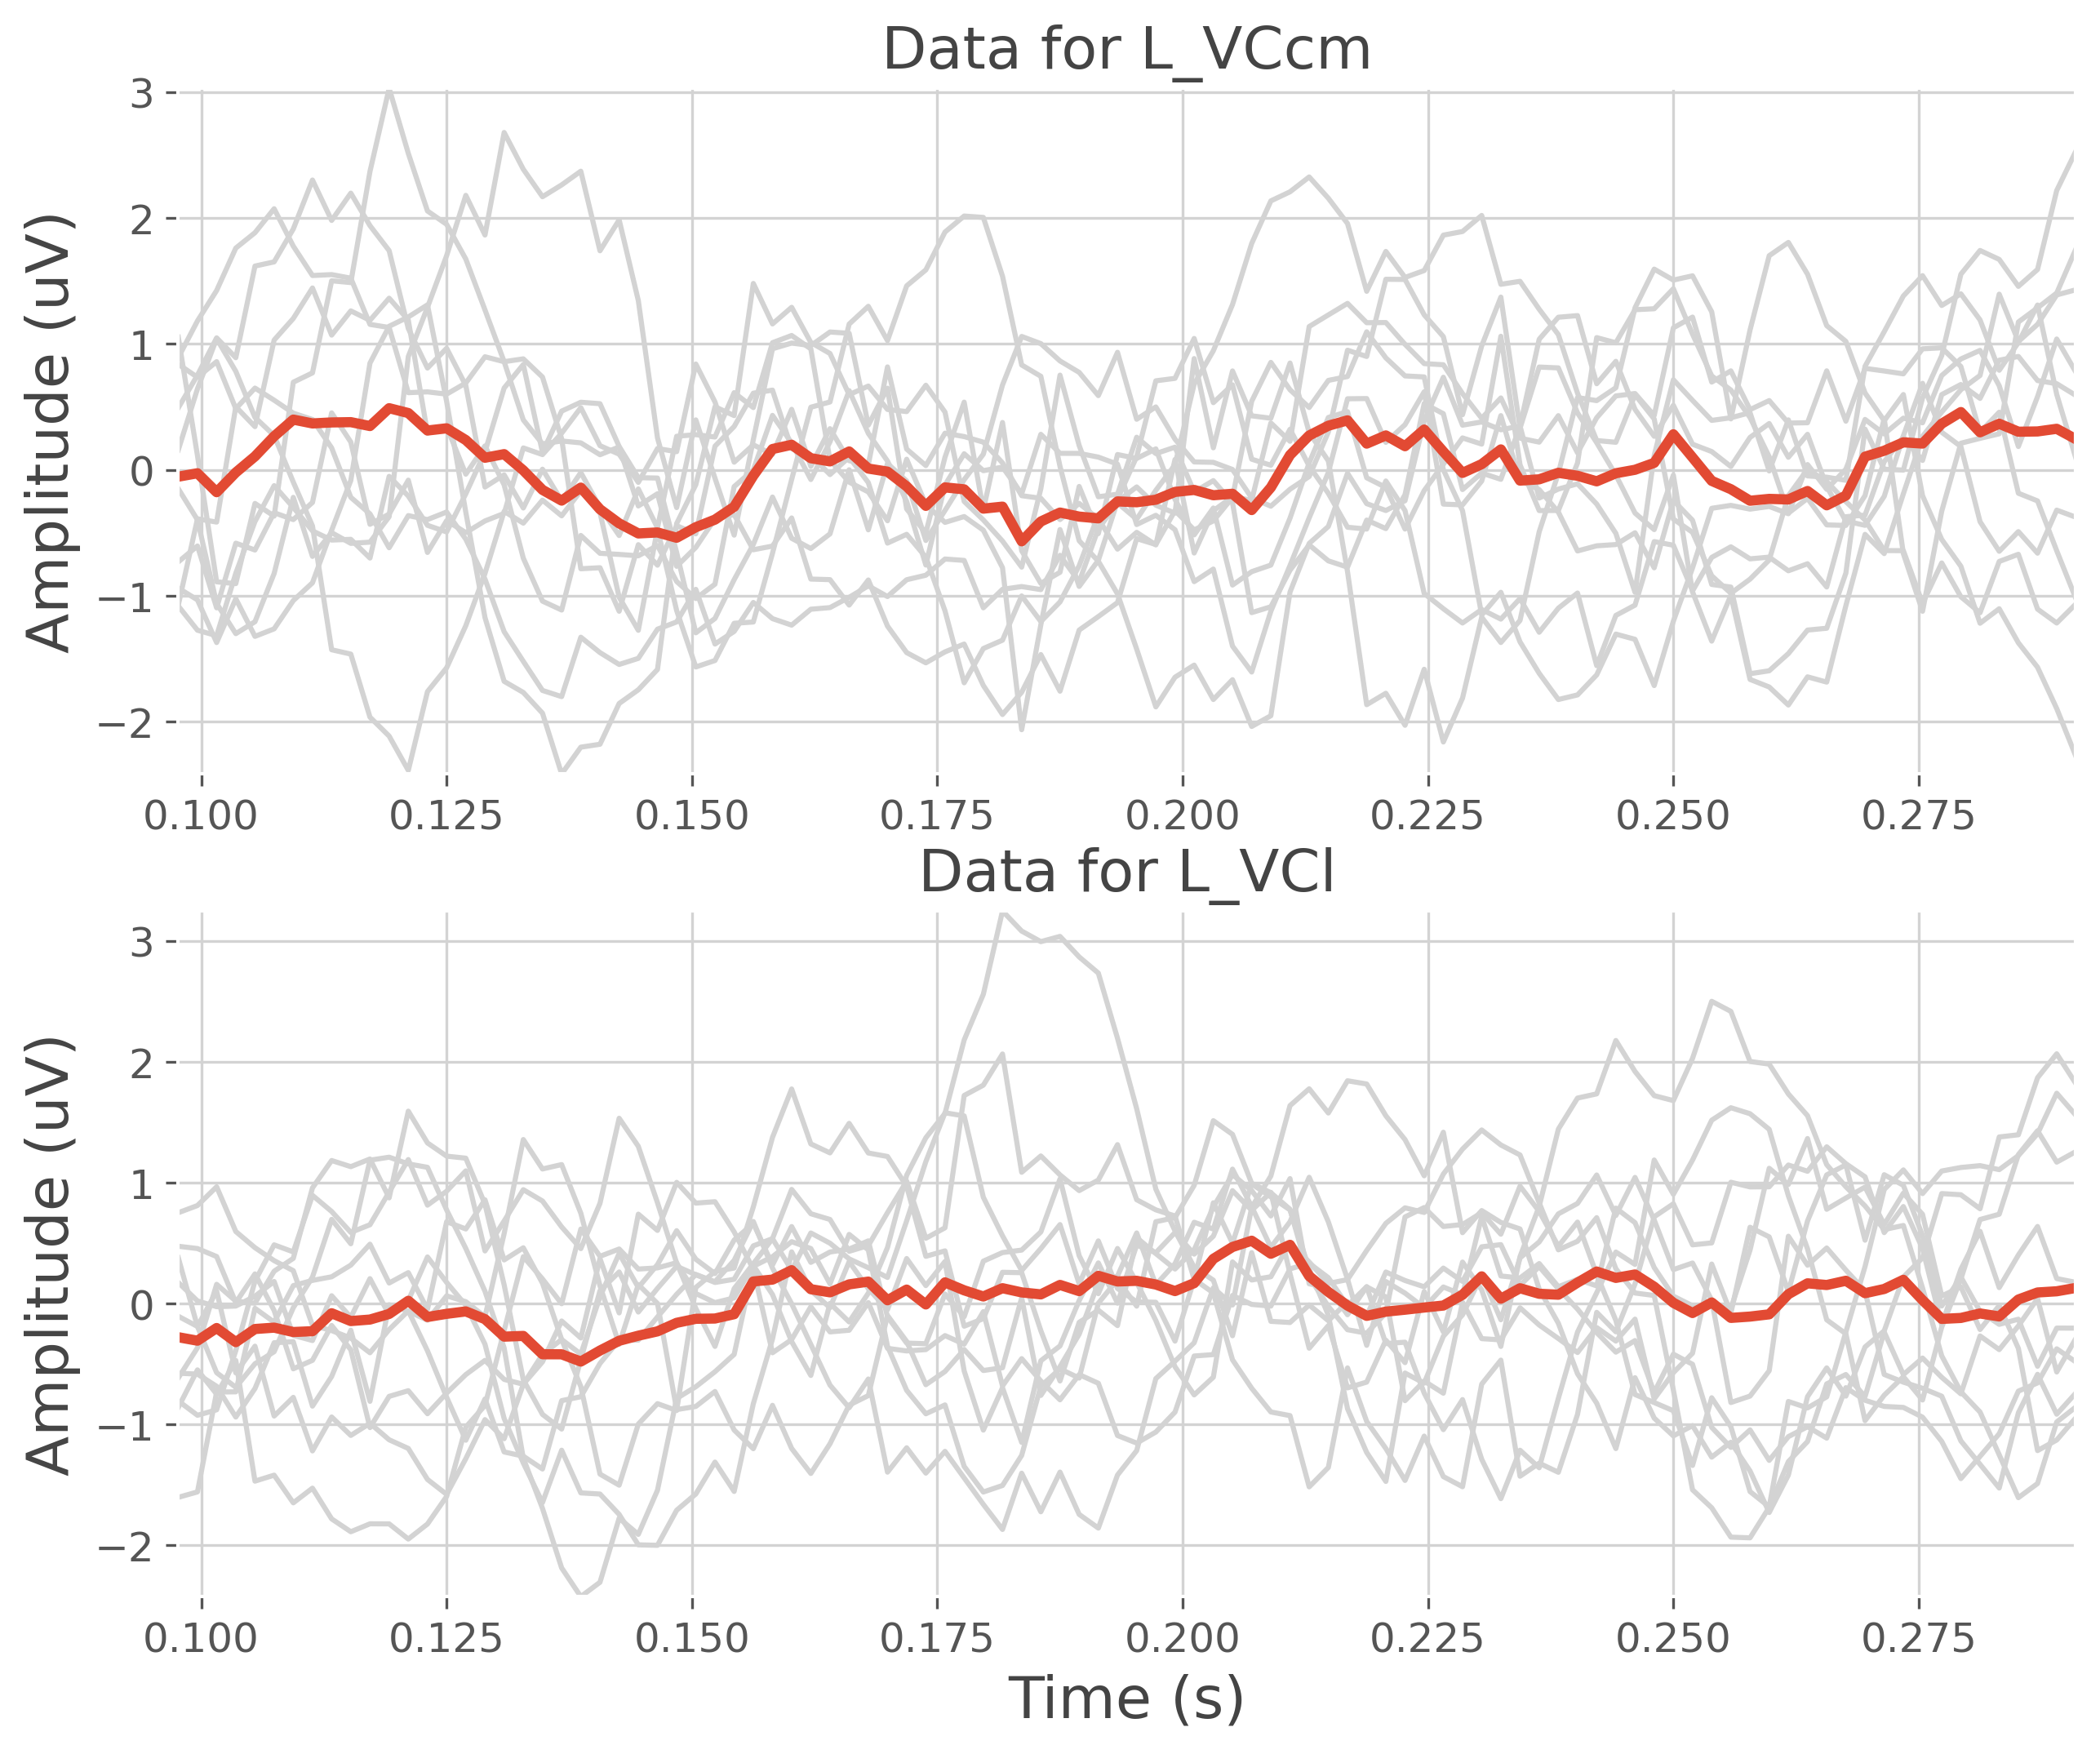
plt.figure(figsize=(10, 8))
plt.subplot(211)
plt.plot(time, data[:, 0, :].T, color='lightgray')
plt.plot(time, data[:, 0, :].mean(0), lw=3)
plt.ylabel("Amplitude (uV)")
plt.title(f"Data for {roi[0]}")
plt.autoscale(tight=True)
plt.subplot(212)
plt.plot(time, data[:, 1, :].T, color='lightgray')
plt.plot(time, data[:, 1, :].mean(0), lw=3)
plt.ylabel("Amplitude (uV)")
plt.xlabel('Time (s)')
plt.title(f"Data for {roi[1]}")
plt.autoscale(tight=True)
plt.show()

List of defined region of interest : ['L_VCcm' 'L_VCl']
Generate electrophysiological for multiple subjects#
Similarly to the creation of a dataset for a single subject the function
frites.simulations.sim_multi_suj_ephy() allows the creation of
electrophysiological datasets for multiple subjects. The returned dataset is
a list of length n_subjects composed with arrays of shape (n_epochs,
n_sites, n_times)
modality = 'meeg'
n_subjects = 3
n_epochs = 10
n_roi = 1
n_sites_per_roi = 1
n_times = 100
data, roi, time = sim_multi_suj_ephy(modality=modality, n_epochs=n_epochs,
                                     n_subjects=n_subjects, n_roi=n_roi,
                                     n_times=n_times,
                                     n_sites_per_roi=n_sites_per_roi)

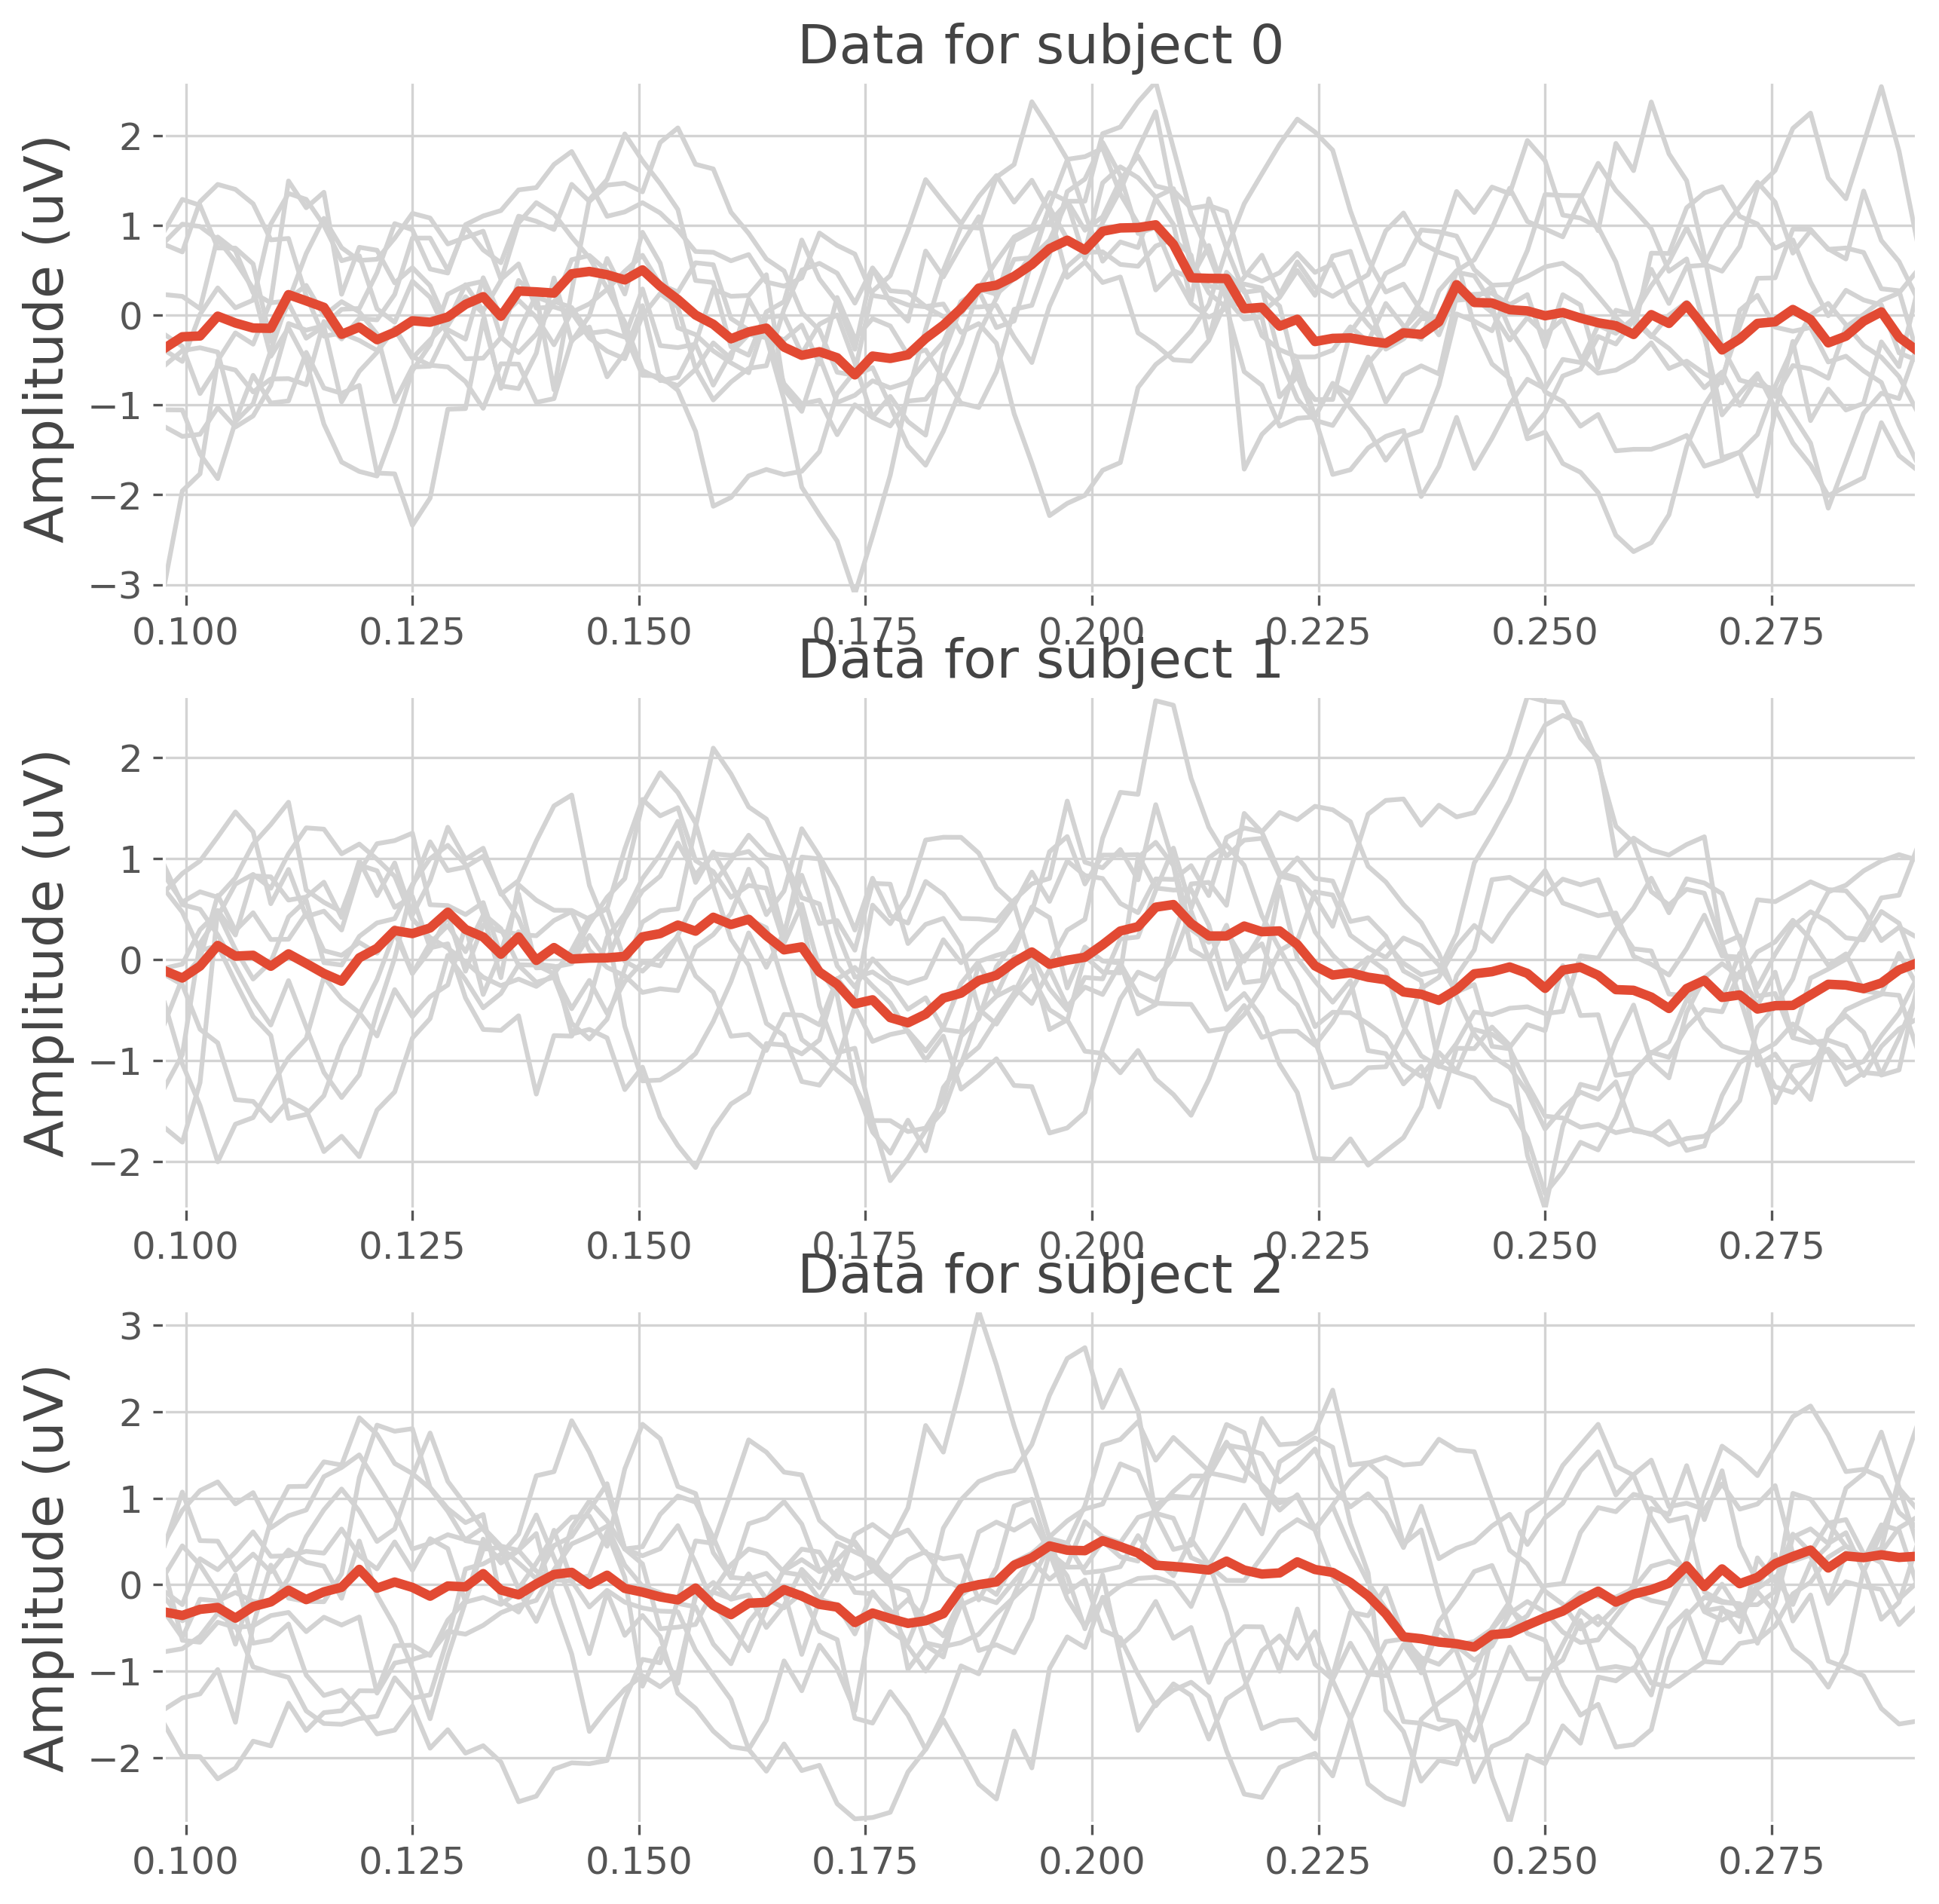
plt.figure(figsize=(10, 10))
for k in range(n_subjects):
    plt.subplot(n_subjects, 1, k + 1)
    plt.plot(time, data[k][:, 0, :].T, color='lightgray')
    plt.plot(time, data[k][:, 0, :].mean(0), lw=3)
    plt.ylabel("Amplitude (uV)")
    plt.title(f"Data for subject {k}")
    plt.autoscale(tight=True)
plt.show()

Total running time of the script: (0 minutes 2.511 seconds)
Estimated memory usage: 459 MB