Note
Go to the end to download the full example code.
AR : conditional covariance based Granger Causality#
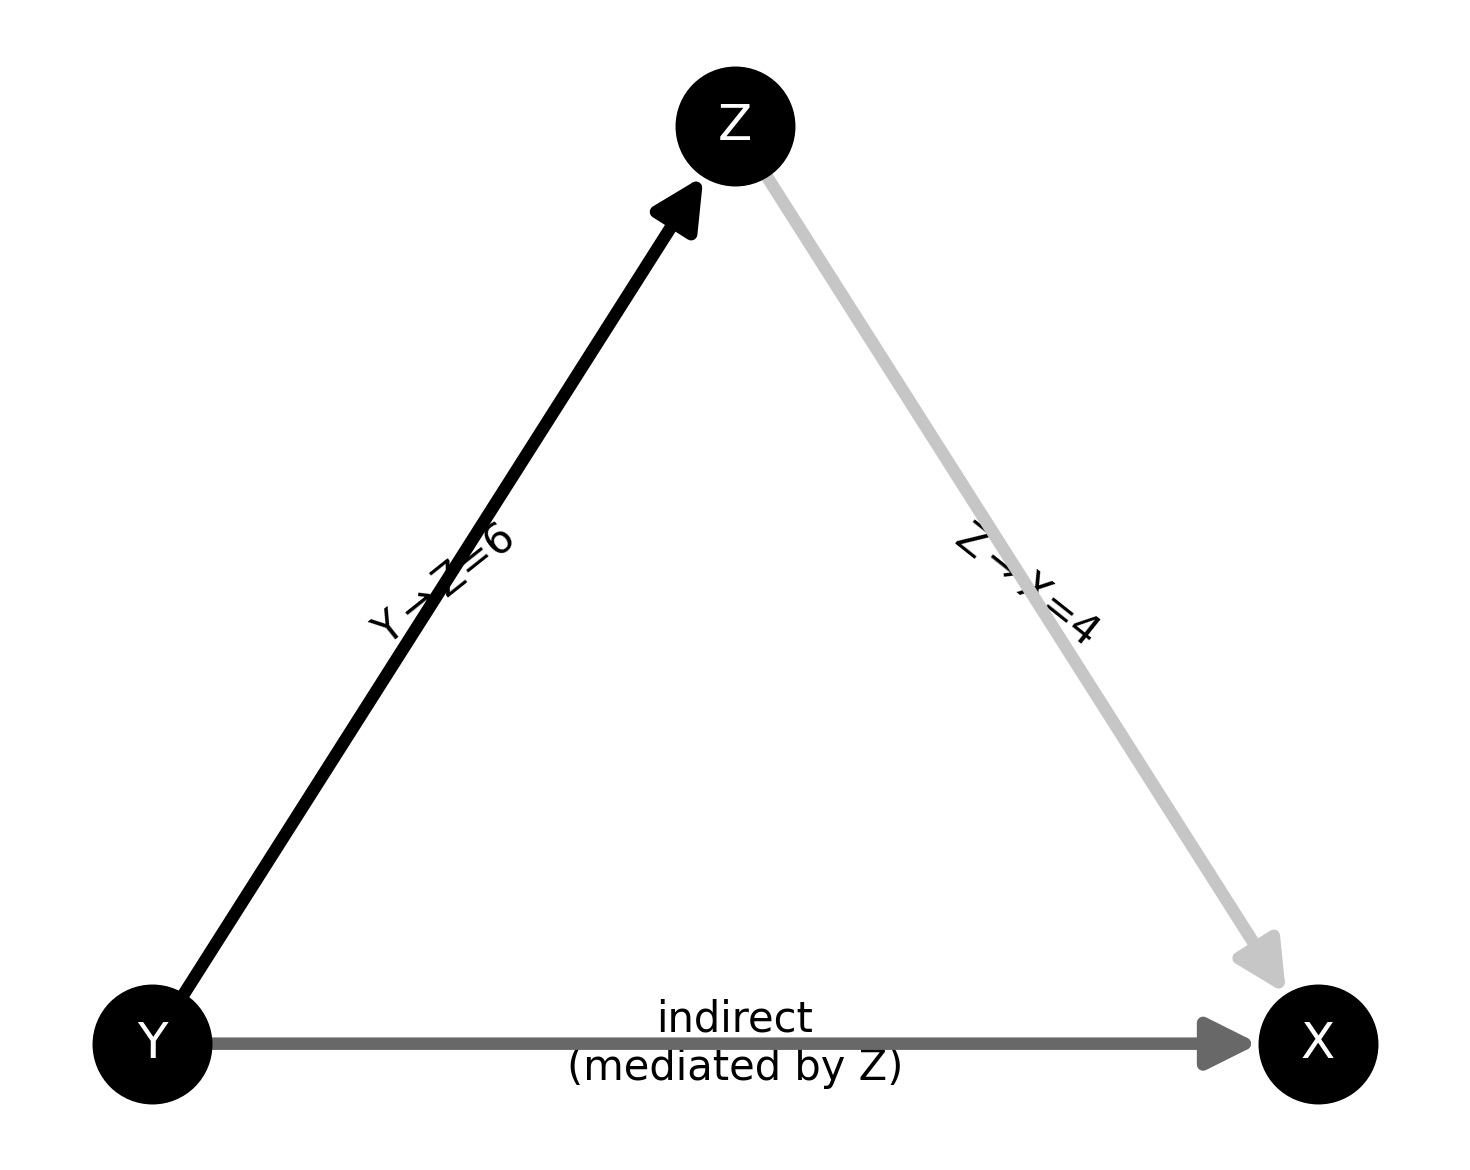
This example reproduces the results of Ding et al. 2006 [7] where in Fig3 there’s an indirect transfer of information from Y->X that is mediated by Z. The problem is that if the Granger Causality is used, there’s indeed a transfer of information from Y->X while with the conditional Granger causality, conditioning by the past of other sources suppresses this indirect transfer.
import numpy as np

from frites import set_mpl_style
from frites.simulations import StimSpecAR
from frites.conn import conn_covgc

import matplotlib.pyplot as plt
set_mpl_style()
Simulate 3 nodes 40hz oscillations#
Here, we use the class frites.simulations.StimSpecAR to simulate an
stimulus-specific autoregressive model made of three nodes (X, Y and Z). This
network simulates a transfer Y->Z and Z->X such as an indirect transfer from
Y->X mediated by Z
ar_type = 'ding_3_indirect'  # 40hz oscillations
n_stim = 2                   # number of stimulus
n_epochs = 50                # number of epochs per stimulus

ss = StimSpecAR()
ar = ss.fit(ar_type=ar_type, n_epochs=n_epochs, n_stim=n_stim)
plot the network
plt.figure(figsize=(5, 4))
ss.plot_model()
plt.show()
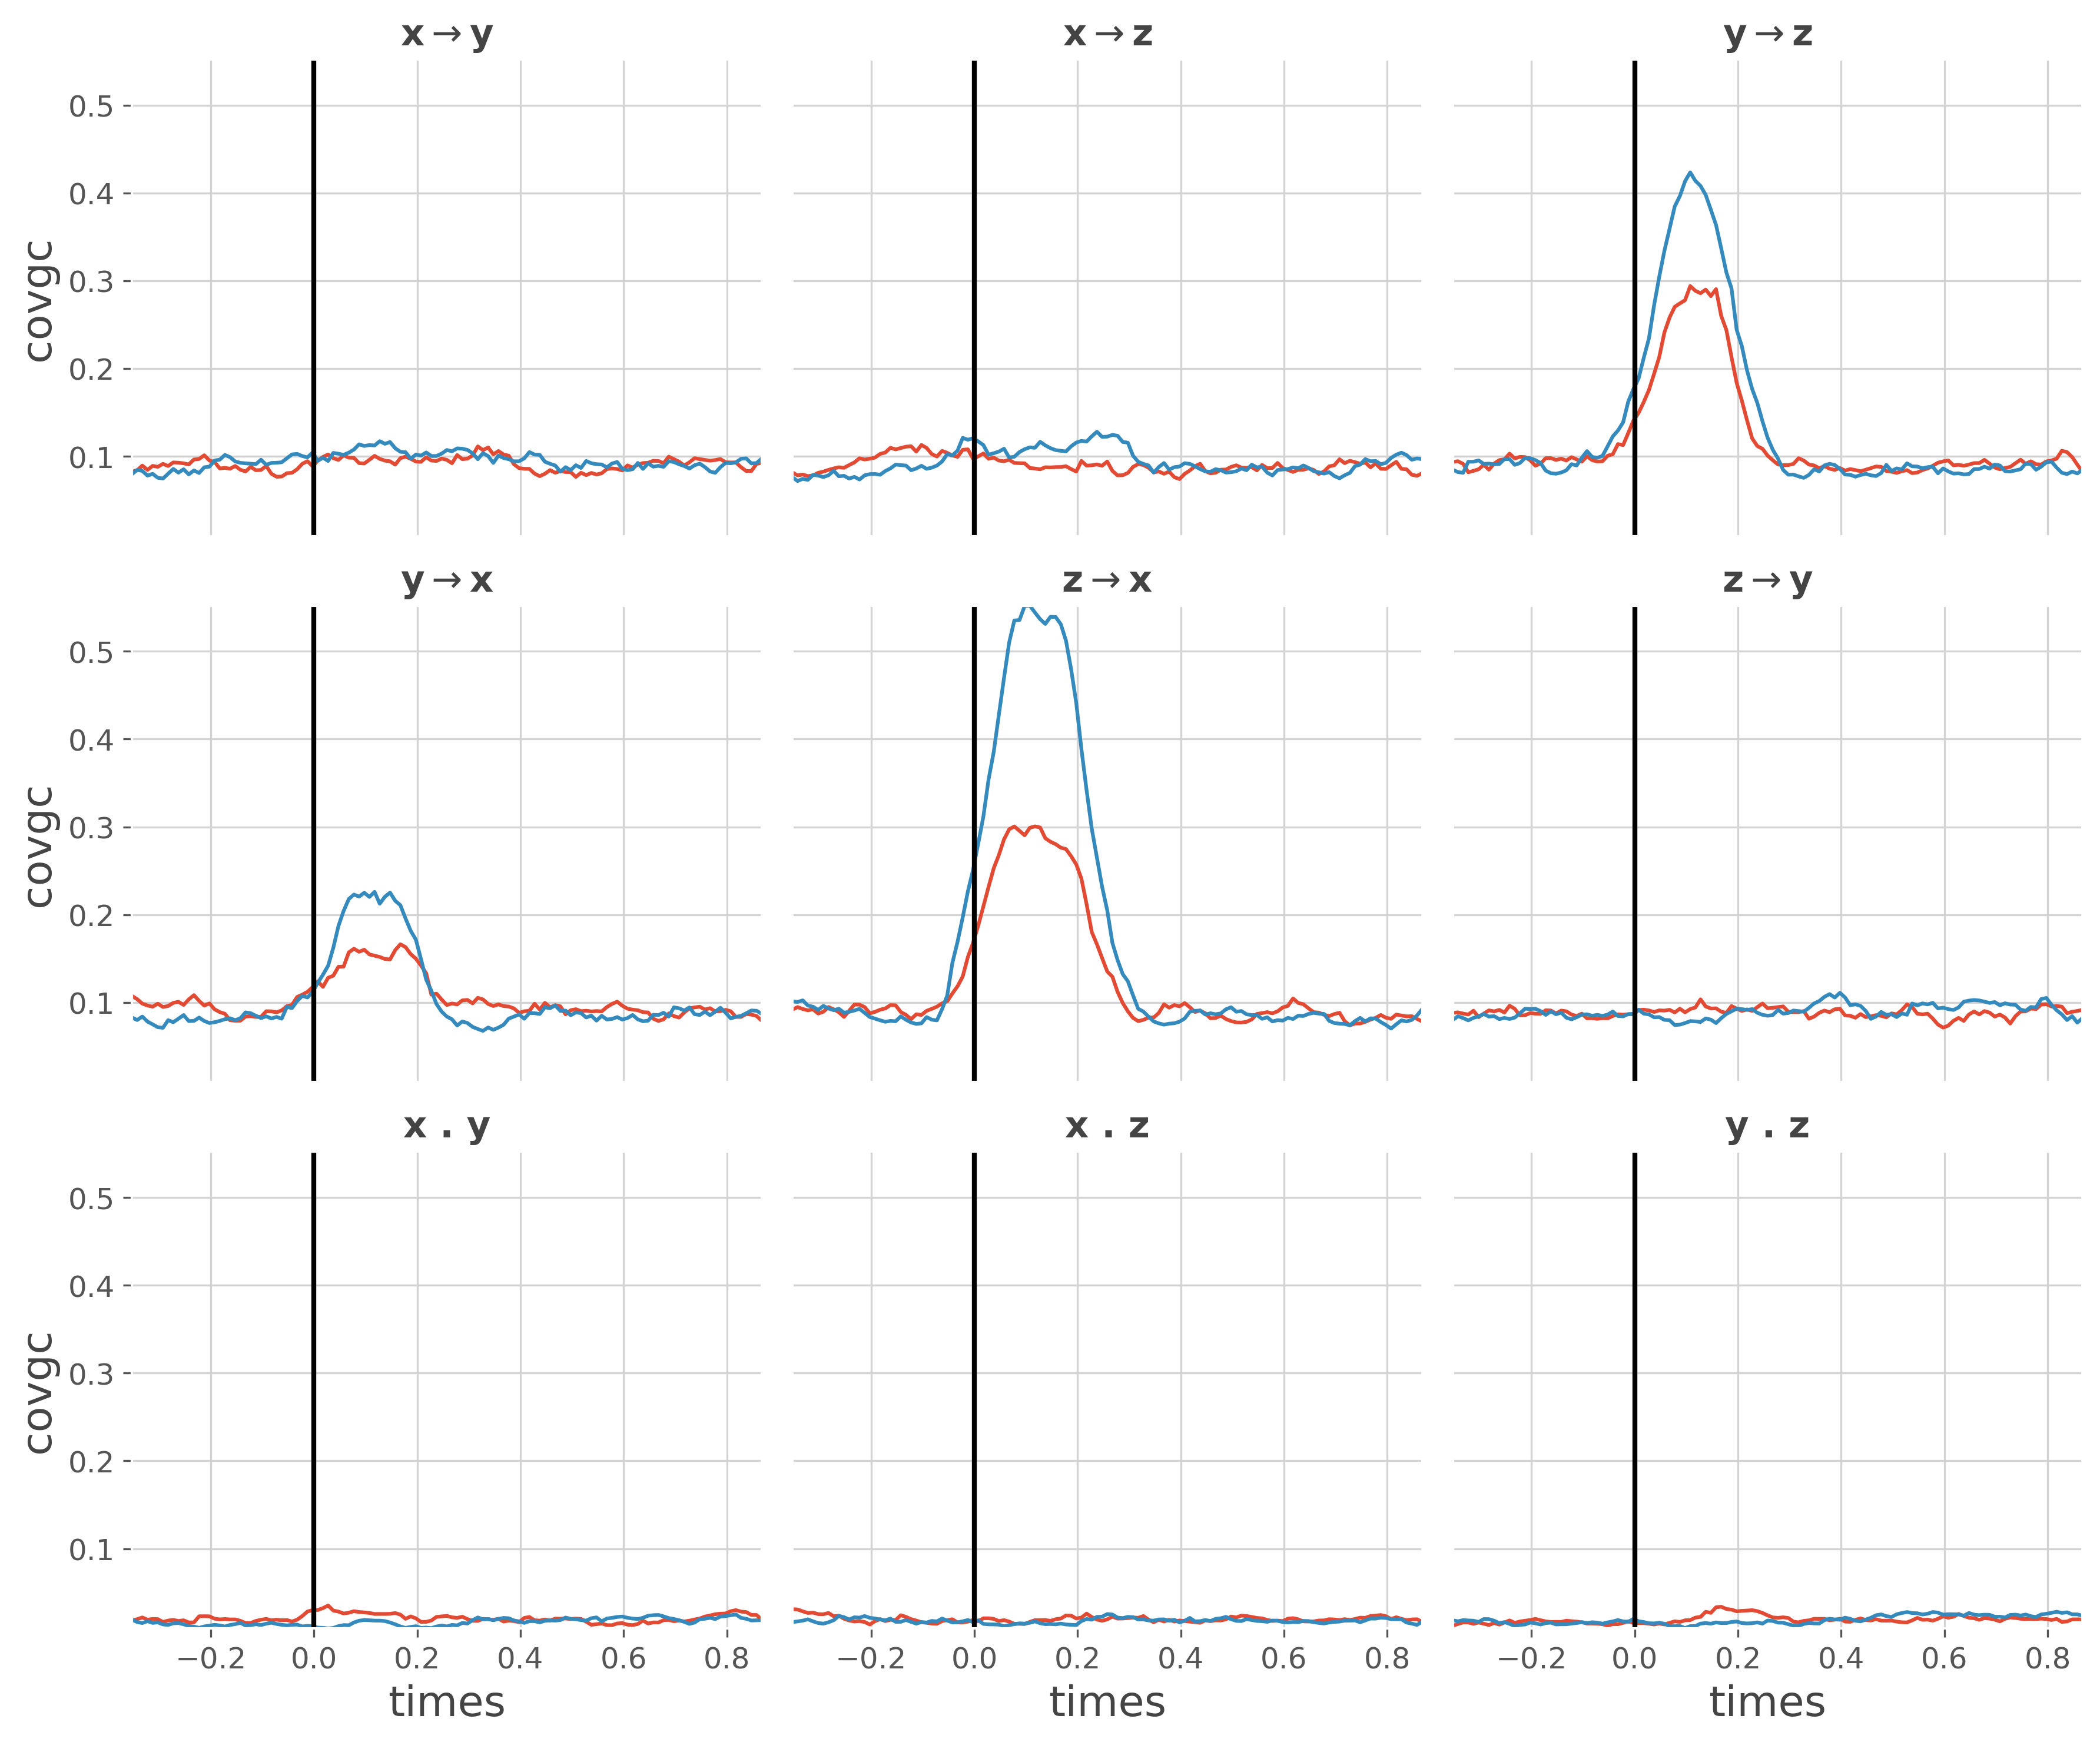
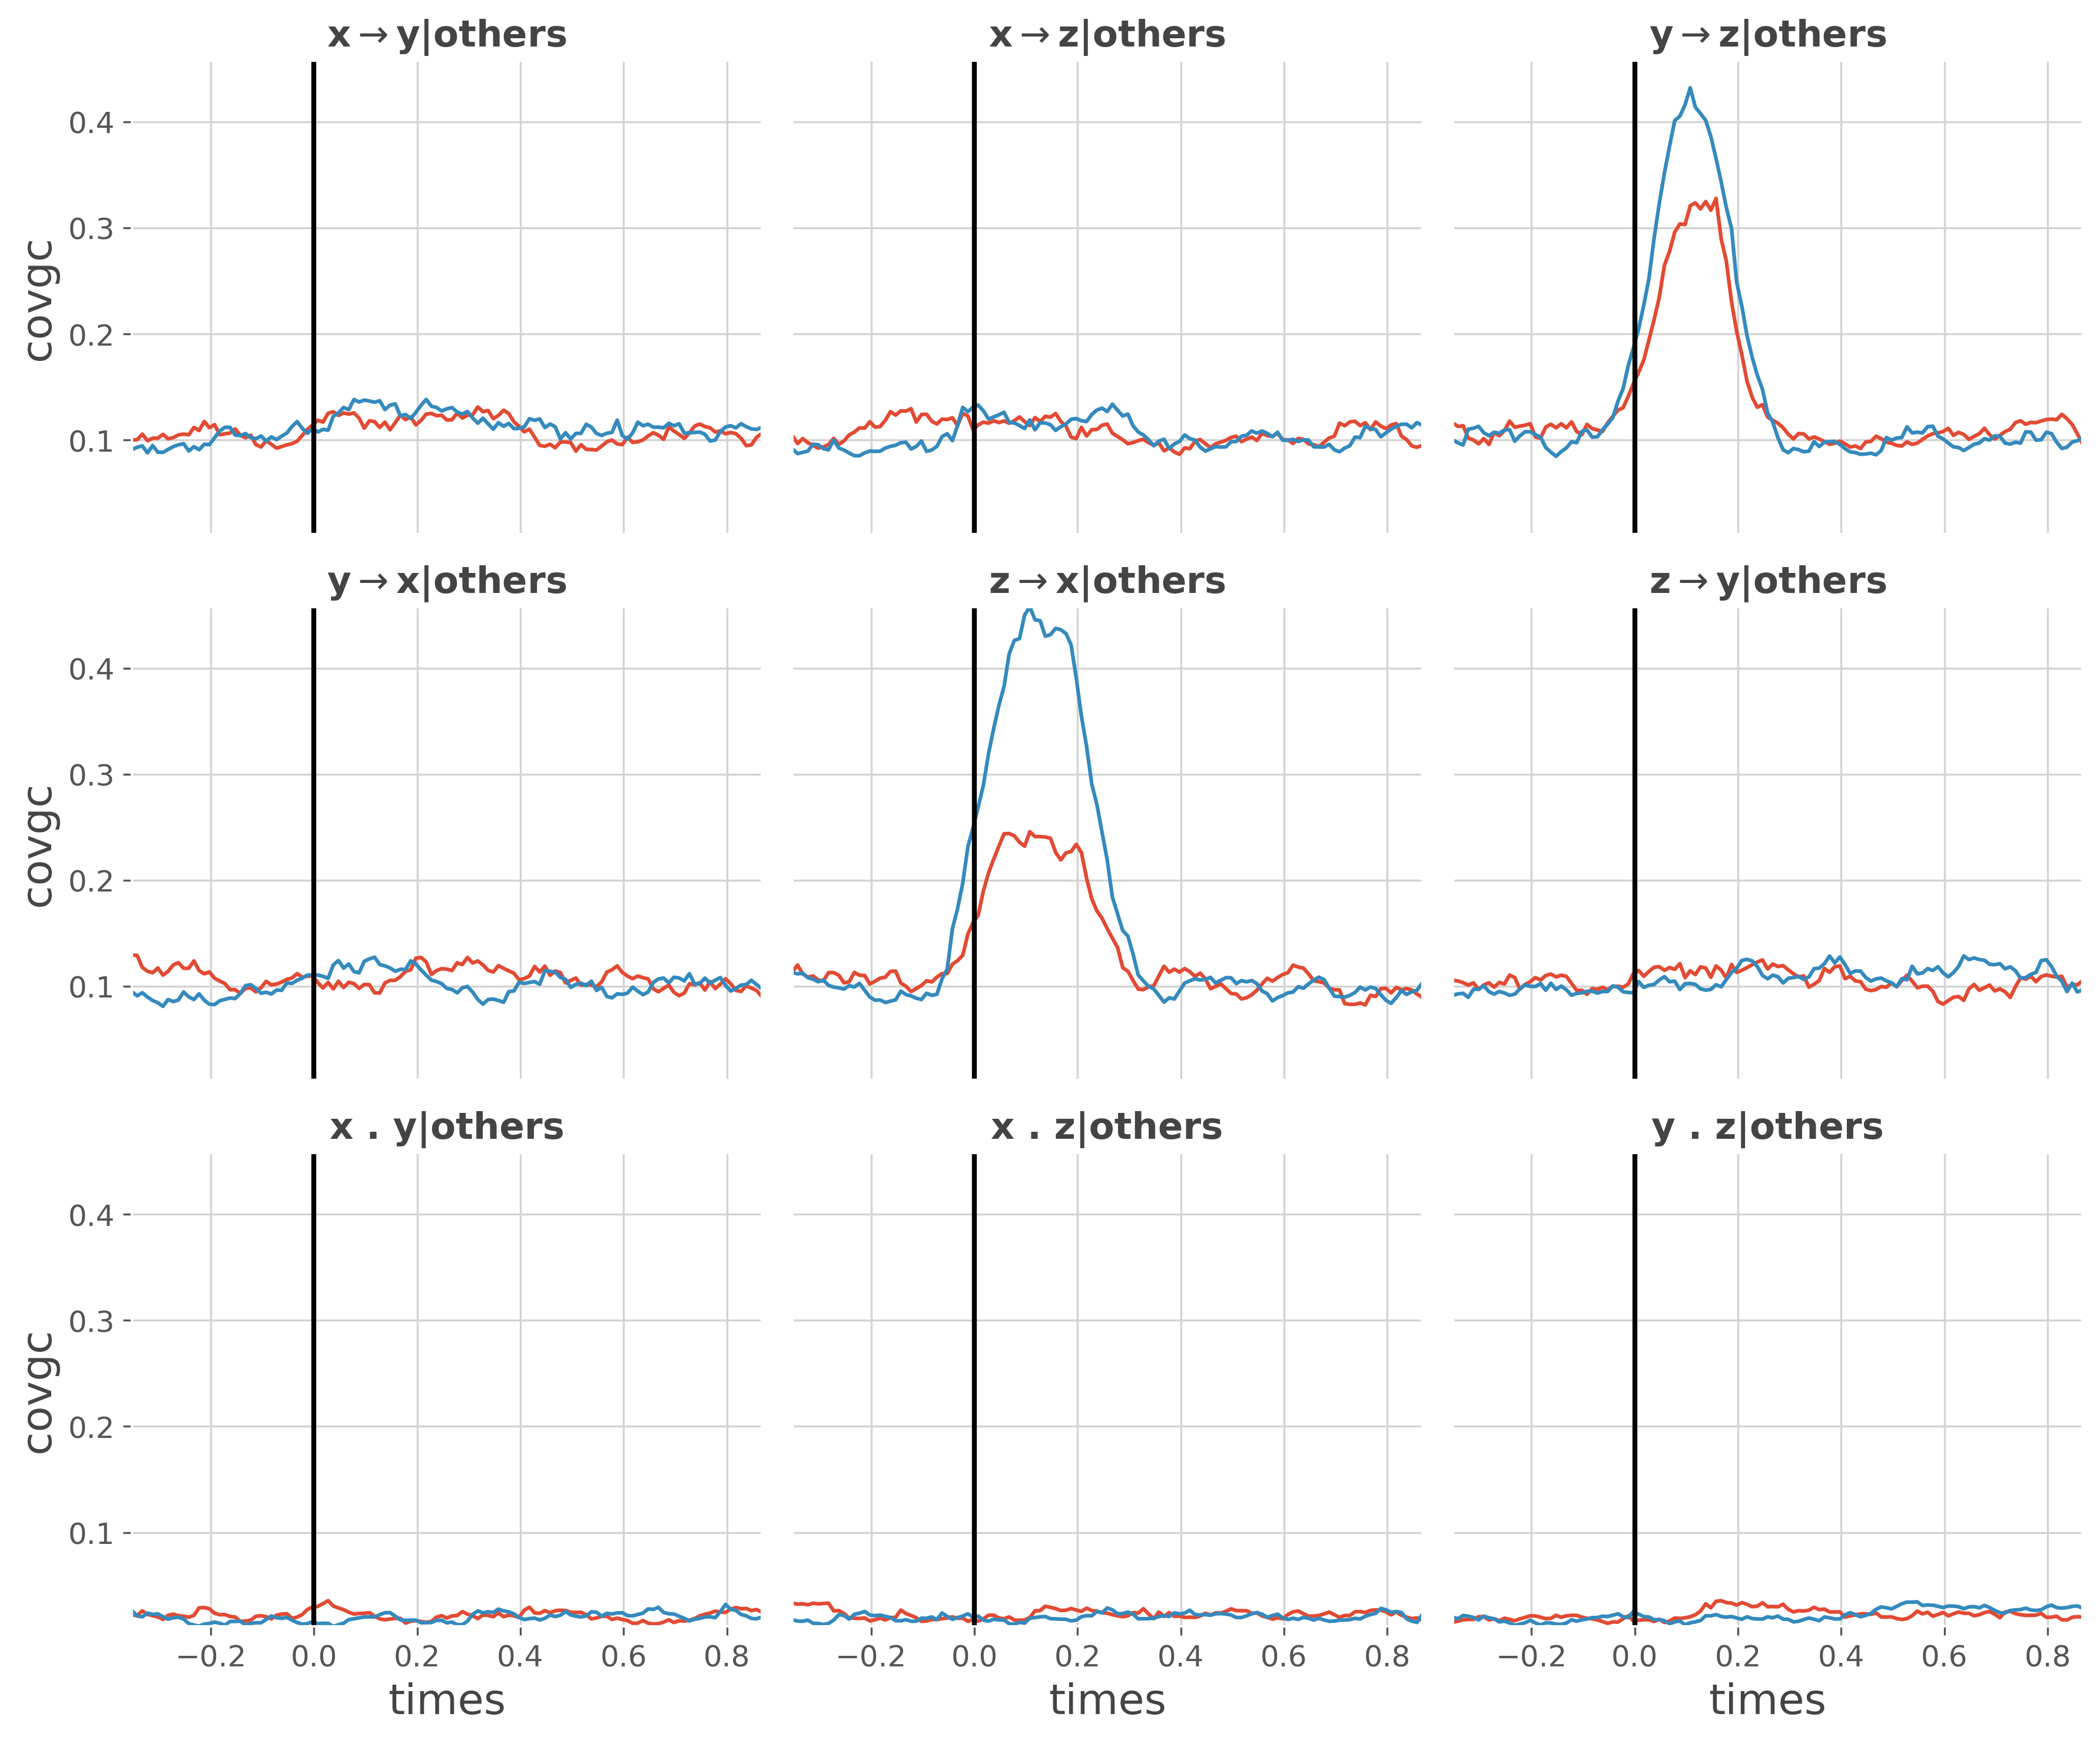
Compute the Granger-Causality#
We first compute the Granger Causality and then the conditional Granger causality (i.e conditioning by the past coming from other sources)
dt, lag, step = 50, 5, 2
t0 = np.arange(lag, ar.shape[-1] - dt, step)
kw_gc = dict(dt=dt, lag=lag, step=1, t0=t0, roi='roi', times='times',
             n_jobs=-1)
# granger causality
gc = conn_covgc(ar, conditional=False, **kw_gc)

# conditional granger causality
gc_cond = conn_covgc(ar, conditional=True, **kw_gc)
  0%|          |  : 0/3 [00:00<?,       ?it/s]
100%|██████████|  : 3/3 [00:00<00:00, 3850.34it/s]

  0%|          |  : 0/3 [00:00<?,       ?it/s]
100%|██████████|  : 3/3 [00:00<00:00, 7345.54it/s]
Plot the Granger causality
plt.figure(figsize=(12, 10))
ss.plot_covgc(gc)
plt.tight_layout()
plt.show()
Plot the conditional Granger causality
plt.figure(figsize=(12, 10))
ss.plot_covgc(gc_cond)
plt.tight_layout()
plt.show()
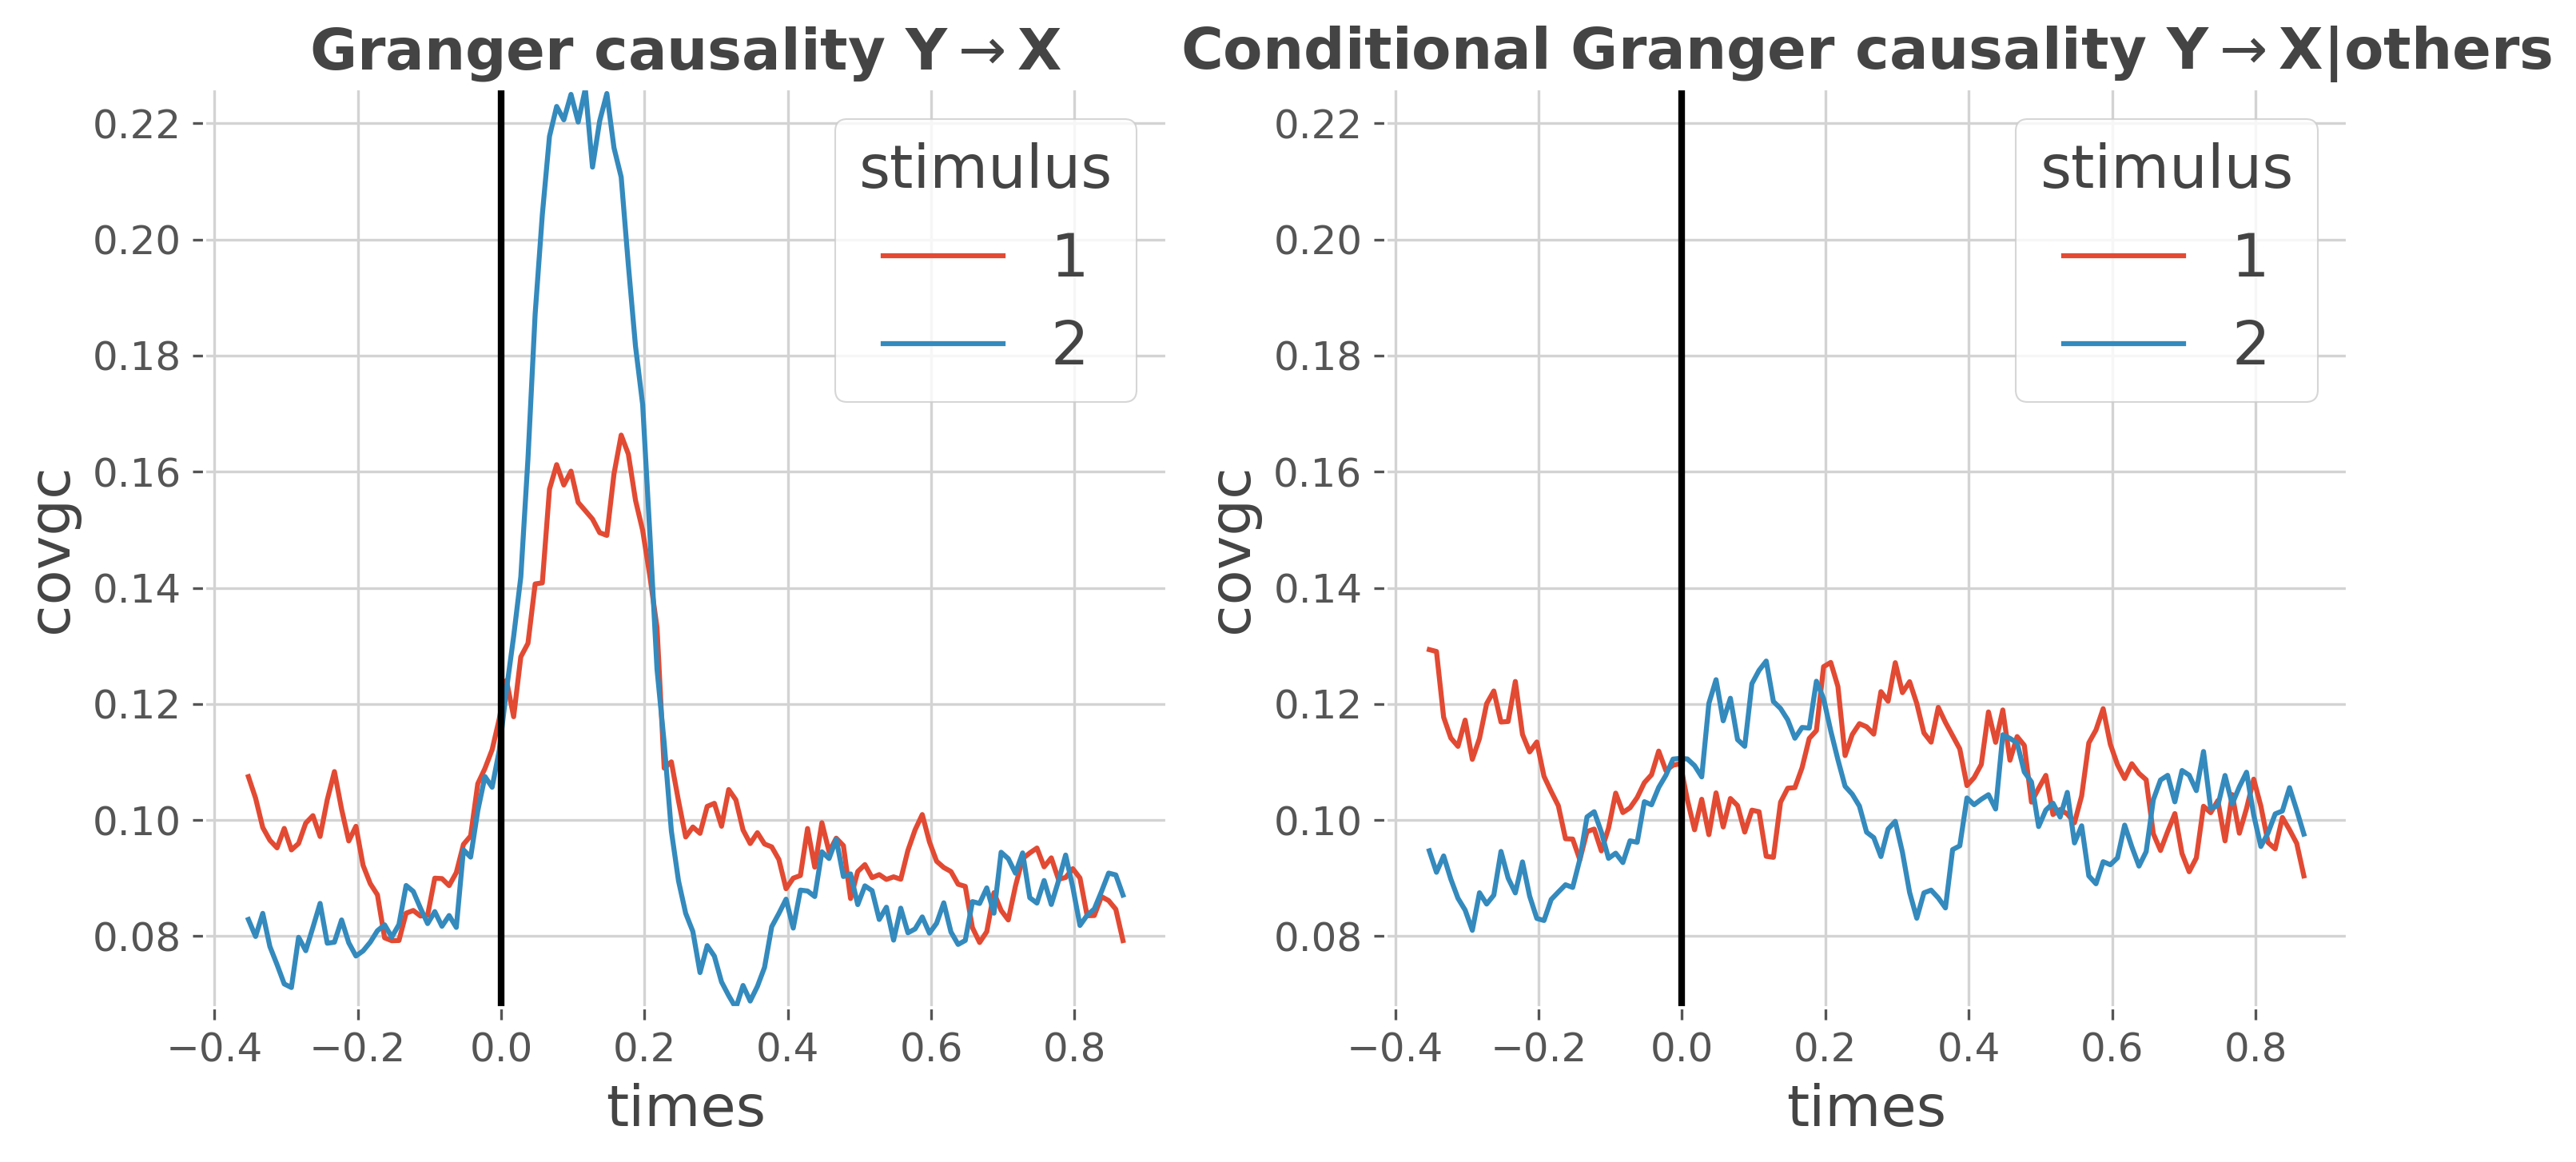
Direct comparison#
In this plot, we only select the transfer of information from Y->X for both granger and conditional granger causality
# select Y->X and mean per stimulus for the granger causality
gc_yx = gc.sel(roi='x-y', direction='y->x').groupby('trials').mean('trials')
gc_yx = gc_yx.rename({'trials': 'stimulus'})

# select Y->X and mean per stimulus for the conditional granger causality
gc_cond_yx = gc_cond.sel(roi='x-y', direction='y->x').groupby('trials').mean(
    'trials')
gc_cond_yx = gc_cond_yx.rename({'trials': 'stimulus'})

# get (min, max) of granger causality from Y->X
gc_min = min(gc_yx.data.min(), gc_cond_yx.data.min())
gc_max = max(gc_yx.data.max(), gc_cond_yx.data.max())

# sphinx_gallery_thumbnail_number = 4
plt.figure(figsize=(10, 5))
# plot granger causality from Y->X
plt.subplot(121)
gc_yx.plot.line(x='times', hue='stimulus')
plt.title(r'Granger causality Y$\rightarrow$X', fontweight='bold')
plt.axvline(0, color='k', lw=2)
plt.ylim(gc_min, gc_max)
# plot the conditional granger causality from Y->X
plt.subplot(122)
gc_cond_yx.plot.line(x='times', hue='stimulus')
plt.title(r'Conditional Granger causality Y$\rightarrow$X|others',
          fontweight='bold')
plt.axvline(0, color='k', lw=2)
plt.ylim(gc_min, gc_max)
plt.tight_layout()

plt.show()
Total running time of the script: (0 minutes 23.382 seconds)
Estimated memory usage: 509 MB